A study found that highway drivers in one state traveled at an average speed of 59.6 miles per hour (MPH). Assume the population standard deviation is 6.9 MPH. Complete parts a through d below. a. What is the probability that a sample of 30 of the drivers will have a sample mean less than 58 MPH? P(x< 58) =O (Round to four decimal places as needed.) b. What is the probability that a sample of 40 of the drivers will have a sample mean less than 58 MPH? P(x<58) =O (Round to four decimal places as needed.) c. What is the probability that a sample of 50 of the drivers will have a sample mean less than 58 MPH? P(x< 58) =O (Round to four decimal places as needed.) d. Explain the difference in these probabilities. As the sample size increases, the standard error of the mean and the sample means V the population mean of 59.6 MPH. Therefore, the probability of observing a sample mean less than 58 MPH Enter vOur answer in each of the answer boxes
A study found that highway drivers in one state traveled at an average speed of 59.6 miles per hour (MPH). Assume the population standard deviation is 6.9 MPH. Complete parts a through d below. a. What is the probability that a sample of 30 of the drivers will have a sample mean less than 58 MPH? P(x< 58) =O (Round to four decimal places as needed.) b. What is the probability that a sample of 40 of the drivers will have a sample mean less than 58 MPH? P(x<58) =O (Round to four decimal places as needed.) c. What is the probability that a sample of 50 of the drivers will have a sample mean less than 58 MPH? P(x< 58) =O (Round to four decimal places as needed.) d. Explain the difference in these probabilities. As the sample size increases, the standard error of the mean and the sample means V the population mean of 59.6 MPH. Therefore, the probability of observing a sample mean less than 58 MPH Enter vOur answer in each of the answer boxes

Glencoe Algebra 1, Student Edition, 9780079039897, 0079039898, 2018
18th Edition
ISBN:9780079039897
Author:Carter
Publisher:Carter
Chapter10: Statistics
Section10.4: Distributions Of Data
Problem 19PFA

Related questions

Question
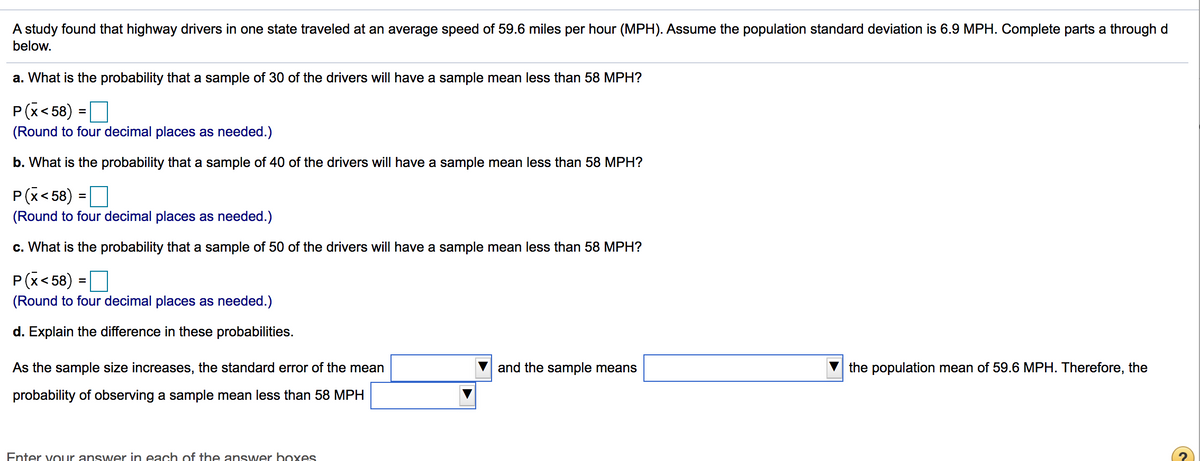
Transcribed Image Text:A study found that highway drivers in one state traveled at an average speed of 59.6 miles per hour (MPH). Assume the population standard deviation is 6.9 MPH. Complete parts a through d
below.
a. What is the probability that a sample of 30 of the drivers will have a sample mean less than 58 MPH?
P(x< 58) =O
%3D
(Round to four decimal places as needed.)
b. What is the probability that a sample of 40 of the drivers will have a sample mean less than 58 MPH?
P(x< 58) =O
%3D
(Round to four decimal places as needed.)
c. What is the probability that a sample of 50 of the drivers will have a sample mean less than 58 MPH?
P(x< 58) =D
(Round to four decimal places as needed.)
d. Explain the difference in these probabilities.
As the sample size increases, the standard error of the mean
and the sample means
the population mean of 59.6 MPH. Therefore, the
probability of observing a sample mean less than 58 MPH
Enter vour answer in each of the answer boxes
Expert Solution
This question has been solved!
Explore an expertly crafted, step-by-step solution for a thorough understanding of key concepts.

This is a popular solution!

Trending now
This is a popular solution!

Step by step
Solved in 2 steps with 2 images

Knowledge Booster


Learn more about
Need a deep-dive on the concept behind this application? Look no further. Learn more about this topic, statistics and related others by exploring similar questions and additional content below.Recommended textbooks for you
Glencoe Algebra 1, Student Edition, 9780079039897…
Algebra
ISBN:
9780079039897
Author:
Carter
Publisher:
McGraw Hill
Glencoe Algebra 1, Student Edition, 9780079039897…
Algebra
ISBN:
9780079039897
Author:
Carter
Publisher:
McGraw Hill