A study measures the dimensions of adult penguin bills for three species (Adelie, Gentoo and Chinstrap) living on an island. Bill lengths and bill depths (millimetres) were taken, as shown in the following diagram: Bill length Bill depth Question 1 In the study it is believed that there is a negative linear relationship between bill lengths and bill depths for the penguins. Define p as the population correlation coefficient between bill length and bill depth. The appropriate null and alternative hypotheses to test are O Ho: p= 0 vs H₁: p0 ○ Ho: p= 0 vs H₁: p < 0 ○ Ho:p> 0 vs H₁ :p <0 Hop= 0 vs H₁ :p>0
A study measures the dimensions of adult penguin bills for three species (Adelie, Gentoo and Chinstrap) living on an island. Bill lengths and bill depths (millimetres) were taken, as shown in the following diagram: Bill length Bill depth Question 1 In the study it is believed that there is a negative linear relationship between bill lengths and bill depths for the penguins. Define p as the population correlation coefficient between bill length and bill depth. The appropriate null and alternative hypotheses to test are O Ho: p= 0 vs H₁: p0 ○ Ho: p= 0 vs H₁: p < 0 ○ Ho:p> 0 vs H₁ :p <0 Hop= 0 vs H₁ :p>0

Glencoe Algebra 1, Student Edition, 9780079039897, 0079039898, 2018
18th Edition
ISBN:9780079039897
Author:Carter
Publisher:Carter
Chapter10: Statistics
Section10.6: Summarizing Categorical Data
Problem 10CYU

Related questions
Question
do question 1 only
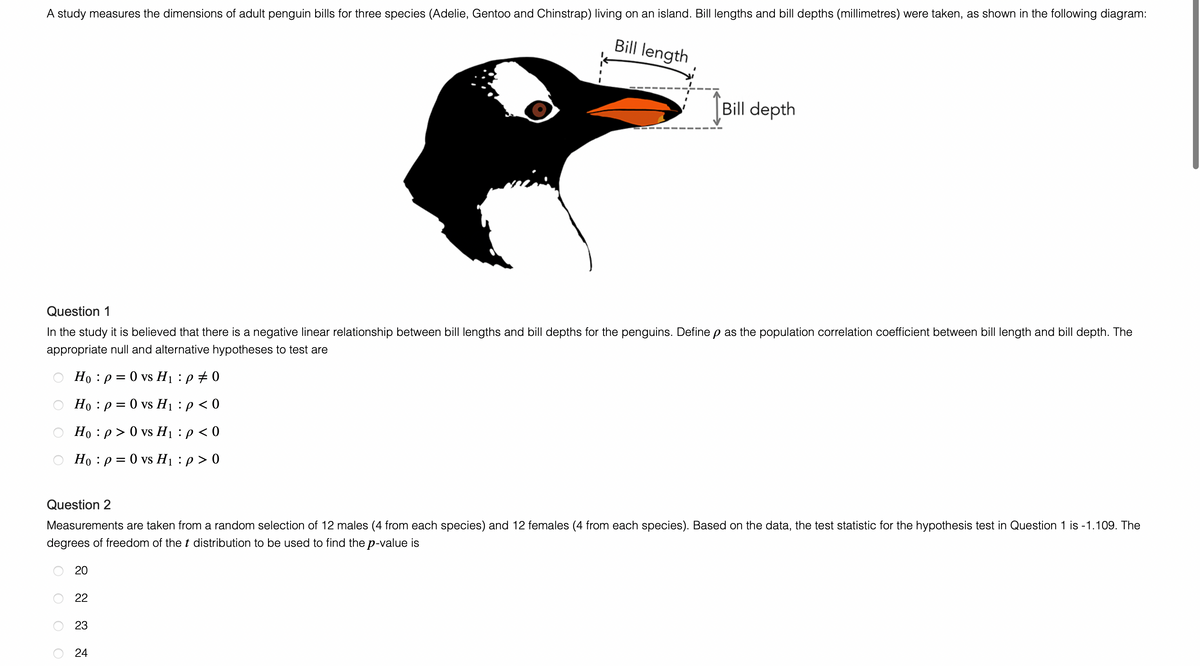
Transcribed Image Text:A study measures the dimensions of adult penguin bills for three species (Adelie, Gentoo and Chinstrap) living on an island. Bill lengths and bill depths (millimetres) were taken, as shown in the following diagram:
Bill length
Bill depth
Question 1
In the study it is believed that there is a negative linear relationship between bill lengths and bill depths for the penguins. Define p as the population correlation coefficient between bill length and bill depth. The
appropriate null and alternative hypotheses to test are
Ho p = 0 vs H₁ :p #0
○ Ho: p= 0 vs H₁: p < 0
O Ho:p> 0 vs H₁ : p < 0
○ Ho: p= 0 vs H₁ : p > 0
Question 2
Measurements are taken from a random selection of 12 males (4 from each species) and 12 females (4 from each species). Based on the data, the test statistic for the hypothesis test in Question 1 is -1.109. The
degrees of freedom of the t distribution to be used to find the p-value is
20
22
23
24
O
O
O
O
Expert Solution
This question has been solved!
Explore an expertly crafted, step-by-step solution for a thorough understanding of key concepts.

This is a popular solution!

Trending now
This is a popular solution!

Step by step
Solved in 2 steps with 2 images

Recommended textbooks for you
Glencoe Algebra 1, Student Edition, 9780079039897…
Algebra
ISBN:
9780079039897
Author:
Carter
Publisher:
McGraw Hill

Big Ideas Math A Bridge To Success Algebra 1: Stu…
Algebra
ISBN:
9781680331141
Author:
HOUGHTON MIFFLIN HARCOURT
Publisher:
Houghton Mifflin Harcourt
Glencoe Algebra 1, Student Edition, 9780079039897…
Algebra
ISBN:
9780079039897
Author:
Carter
Publisher:
McGraw Hill
Big Ideas Math A Bridge To Success Algebra 1: Stu…
Algebra
ISBN:
9781680331141
Author:
HOUGHTON MIFFLIN HARCOURT
Publisher:
Houghton Mifflin Harcourt