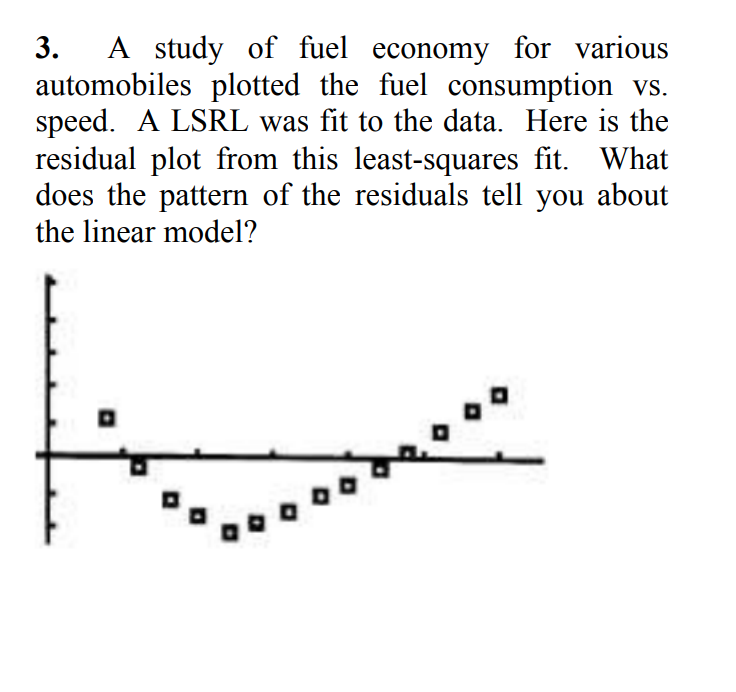
A study of fuel economy for various automobiles plotted the fuel consumption vs. speed. A LSRL was fit to the data. Here is the residual plot from this least-squares fit. What does the pattern of the residuals tell you about the linear model? 3. D
A study of fuel economy for various automobiles plotted the fuel consumption vs. speed. A LSRL was fit to the data. Here is the residual plot from this least-squares fit. What does the pattern of the residuals tell you about the linear model? 3. D

Chapter3: Polynomial Functions
Section: Chapter Questions
Problem 18T

Related questions
Question
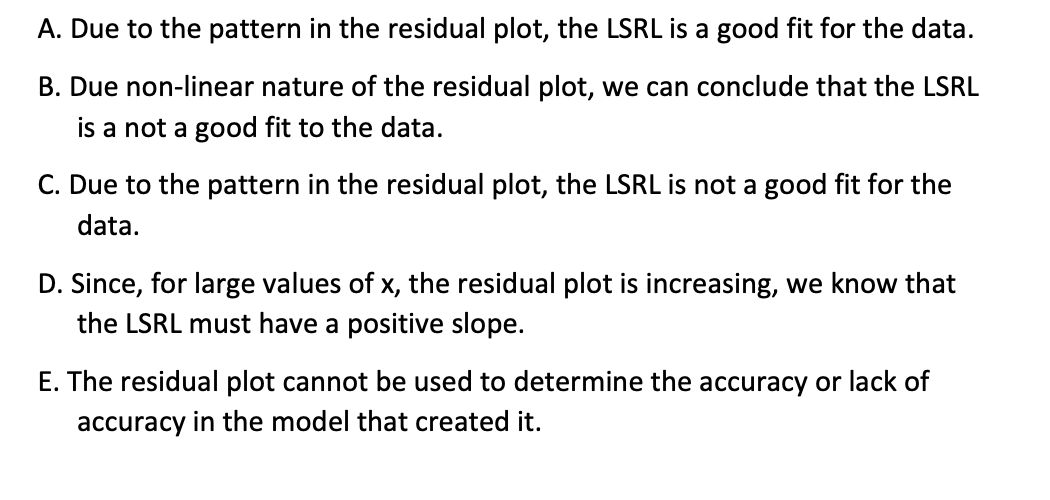
Transcribed Image Text:A. Due to the pattern in the residual plot, the LSRL is a good fit for the data.
B. Due non-linear nature of the residual plot, we can conclude that the LSRL
is a not a good fit to the data.
C. Due to the pattern in the residual plot, the LSRL is not a good fit for the
data.
D. Since, for large values of x, the residual plot is increasing, we know that
the LSRL must have a positive slope.
E. The residual plot cannot be used to determine the accuracy or lack of
accuracy in the model that created it.
Transcribed Image Text:A study of fuel economy for various
automobiles plotted the fuel consumption vs.
speed. A LSRL was fit to the data. Here is the
residual plot from this least-squares fit. What
does the pattern of the residuals tell you about
the linear model?
3.
2
Expert Solution
This question has been solved!
Explore an expertly crafted, step-by-step solution for a thorough understanding of key concepts.

This is a popular solution!

Trending now
This is a popular solution!

Step by step
Solved in 2 steps

Recommended textbooks for you

Glencoe Algebra 1, Student Edition, 9780079039897…
Algebra
ISBN:
9780079039897
Author:
Carter
Publisher:
McGraw Hill

Algebra & Trigonometry with Analytic Geometry
Algebra
ISBN:
9781133382119
Author:
Swokowski
Publisher:
Cengage
Glencoe Algebra 1, Student Edition, 9780079039897…
Algebra
ISBN:
9780079039897
Author:
Carter
Publisher:
McGraw Hill
Algebra & Trigonometry with Analytic Geometry
Algebra
ISBN:
9781133382119
Author:
Swokowski
Publisher:
Cengage

Linear Algebra: A Modern Introduction
Algebra
ISBN:
9781285463247
Author:
David Poole
Publisher:
Cengage Learning