A study of the relationship between age and various visual functions (such as acuity and depth perception) reported the following observations on the area of scleral lamina (mm2) from human optic nerve heads: 2.80 2.68 2.70 3.89 2.28 2.73 4.03 4.15 3.98 4.25 3.47 4.43 2.48 3.67 2.87 3.62 3.06 n USE SALT (a) Calculate Ex, and Ex,2. Ex, = Ex,? = | mm2 mm4 (b) Use the values calculated in part (a) to compute the sample variance s2 and then the sample standard deviation s. (Round your answers to four decimal places.) s2 mm4 mm2
A study of the relationship between age and various visual functions (such as acuity and depth perception) reported the following observations on the area of scleral lamina (mm2) from human optic nerve heads: 2.80 2.68 2.70 3.89 2.28 2.73 4.03 4.15 3.98 4.25 3.47 4.43 2.48 3.67 2.87 3.62 3.06 n USE SALT (a) Calculate Ex, and Ex,2. Ex, = Ex,? = | mm2 mm4 (b) Use the values calculated in part (a) to compute the sample variance s2 and then the sample standard deviation s. (Round your answers to four decimal places.) s2 mm4 mm2

Glencoe Algebra 1, Student Edition, 9780079039897, 0079039898, 2018
18th Edition
ISBN:9780079039897
Author:Carter
Publisher:Carter
Chapter10: Statistics
Section10.1: Measures Of Center
Problem 9PPS

Related questions
Question
Q12
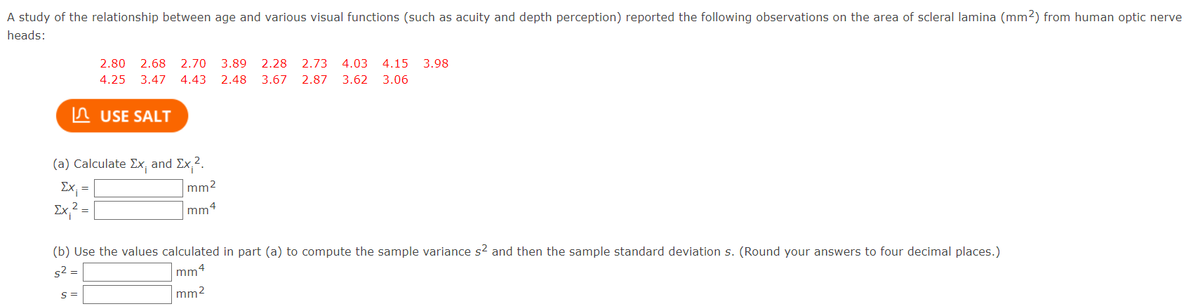
Transcribed Image Text:A study of the relationship between age and various visual functions (such as acuity and depth perception) reported the following observations on the area of scleral lamina (mm2) from human optic nerve
heads:
2.80
2.68
2.70
3.89
2.28
2.73
4.03
4.15
3.98
4.25
3.47
4.43
2.48
3.67
2.87
3.62 3.06
n USE SALT
(a) Calculate Ex, and Ex,2.
Ex, =
mm2
Ex,? =
mm4
(b) Use the values calculated in part (a) to compute the sample variance s2 and then the sample standard deviation s. (Round your answers to four decimal places.)
s2 =
mm
n4
mm2
= S
Expert Solution
This question has been solved!
Explore an expertly crafted, step-by-step solution for a thorough understanding of key concepts.

Step by step
Solved in 3 steps

Recommended textbooks for you
Glencoe Algebra 1, Student Edition, 9780079039897…
Algebra
ISBN:
9780079039897
Author:
Carter
Publisher:
McGraw Hill
Glencoe Algebra 1, Student Edition, 9780079039897…
Algebra
ISBN:
9780079039897
Author:
Carter
Publisher:
McGraw Hill