A study reported by an electric engineering student considered the effect of X-ray inspection of integrated circuits. The radiation dose were studied as a function of current (in milliamps) and exposure time ( in minutes). The data are shown below. S.N 1 2 3 Radiation dose 4 5 6 7 8 9 10 Current 10 10 10 10 15 15 15 20 20 20 7.4 14.8 28.6 59.2 88.8 11.1 14.8 22.2 29.6 59.2 A: Simple Linear regression model between radiation dose and exposure time. Exposure time 0.25 0.5 1 2 3 10 15 0.5 1 2
Q: Use the normal distribution to the right to answer the questions. (a) What percent of the scores are…
A: given data, normal distribution ,μ=19.4σ=5.4we have to find out the probabilities for the given…
Q: A core assumption of linear regression is that the dependent variable and independent variables…
A: A core assumption of linear regression is that the dependent variable and independent variables…
Q: Suppose you flip three coins. What is chance of not getting tails on all three flips?
A: Given that, three coins are tossed, We have to find the chance of not getting tails on all three…
Q: Construct 95% confidence for the population point estimate (sample proportion) which is given as…
A: Given N=40, P=0.4 Level of significance=0.05
Q: "Trydint" bubble-gum company claims that 4 out of 10 people prefer their gum to "Eklypse". Test…
A: Given that: Sample size, n=440 Number of successes, x=154 The company claim that 4 out of 10 people…
Q: The following residual plot has been created as part of the diagnostics of a simple linear…
A: It is provided that the response or dependent variable y denotes the personal income and an…
Q: sume the random variable x is normally distributed with mean μ=82 and standard deviation σ=5. 1.…
A: given data, normal distribution μ=82σ=5we have to find the indicated probability.…
Q: Prove that the sum of deviations from mean is zero.
A:
Q: Q. 64 Give the formula for finding the deciles of a continuous distribution.
A:
Q: group of realtors estimates that 23% of all homes purchased last year were considered investment…
A: Given,n=800p=0.23
Q: The following data are from a completely randomized design. Sample mean Sample variance a. At the a=…
A:
Q: 5. If A and B are independent events, which of the following statements is always true? OA. P(A/B) =…
A: As per our guidelines we are suppose to answer only one question kindlyrepost the remaining…
Q: Which is the stronger level of significance, 0.01 or 0.001? a. 0.001 This is the probability of…
A: In statistics, level of significance Is defined as the probability of making type 1 error. Type 1…
Q: You ask a small sample of 5 students what many hours they spent preparing for the
A: Given, sample size(n) =5 Independent variable (x): Tiem spent studying Dependent variable (y): score…
Q: Use the ALEKS calculator to solve the following problems. (a) Consider a t distribution with 24…
A: Given data Df = 24
Q: Use the following payoff table to complete parts (a) through (j). The probability of event 1 is…
A: Introduction: This question comes under decision theory. Given, P(Event 1) = 0.3 P(Event 2) = 0.5…
Q: elephone survey of 300 randomly selected US adults found that 10% of them play golf. Does this…
A: given data, n=300p^=10%=0.10claim:p<0.15α=1%=0.01we have to test the claim for hypothesis testing…
Q: A population has a mean μ = 134 and a standard deviation o = 26. Find the mean and standard…
A: Given that Population mean (μ) = 134 Standard deviation (σ) = 26 Sample size (n) = 59 We know…
Q: you tell me how you got 100204?
A: From given data we have : sample size n=4 population mean μ=100 standard deviation s=20 sample mean…
Q: 1. An event outside the sample space has a probability approximately equal to zero. TRUE FALSE
A: Defination Sample space: Sample space may be defined as the total possible outcomes. Note:…
Q: d) Calculate the test statistic. (give to 3 decimal places) A/ e) Determine the P-value. Give your…
A: Given that Sample size n =45 Sample mean=176.9 Standard deviation =14.8
Q: Based on a survey, 37% of likely voters would be willing to vote by internet instead of the…
A: Givenp=0.37sample size(n)=14Let "x" be no.of votors would do internet…
Q: The proportion p of residents in a community who recycle has traditionally been 60%. A policy maker…
A: As per our guidelines we are suppose to answer only one question. Given,population…
Q: Use the accompanying 200 Los Angeles commute times to test the claim that the mean Los Angeles…
A: Given that, Sample size (n) = 200 Population mean (μ)= 35 Level of significance (α) = 0.05 To…
Q: o test whether the mean time needed to mix a batch of material is the same for machines produced by…
A: Answer: For Manufacturer 1: sample size (n1) = 4 sample mean (x̄1) = Σx1 /n1 =72/4 = 18 sample…
Q: The piston diameter of a certain hand pump is 0.4 inch. The manager determines that the diameters…
A:
Q: In the Kruskal-Wallis test for the following data, what is the sum of the ranks for Sample Sample 1…
A: Given data: Sample 1 Sample 2 Sample 3 54 52 43 58 53 45 63 53 56
Q: A food safety guideline is that the mercury in fish should be below 1 part per million (ppm).…
A:
Q: Suppose a jar contains 14 red marbles and 34 blue marble. If you reach in the jor and pull at the…
A: There is 14 red marbles and 34 blue marbles in the jar.
Q: Q. 15 There are (n + 1) observations in a sample. If ₁ is the mean of the first n numbers and ₂ is…
A:
Q: Many high school students take the AP tests in different subject areas. In one year, of the 210,598…
A: given data n1 = n2 = 210598female : x1 =104975p^1 = x1n1 = 104975210598 = 0.4985 n2 = 210598…
Q: In the Kruskal-Wallis test for the following data, what is the sum of the ranks for Sample 3? Sample…
A: Give the ranks for the three samples combinedly from lowest number to largest number. If there are…
Q: What are four main functions of statistics?
A: Find: The four main functions of statistics.
Q: Refer to the accompanying table, which describes results from groups of 8 births from 8 different…
A: Given data is x P(x) 0 0.005 1 0.032 2 0.106 3 0.221 4 0.292 5 0.215 6 0.101 7…
Q: You want to estimate how much a typical Georgia family is spending on groceries weekly, now that…
A: Solution-: Given: x¯=142.88, n=51, s=43.08 We want to (d) Interpret the 90% C.I. in simple language…
Q: Has the proportion of Americans that are "20-somethings" decreased? According to the US Census…
A: Givensample size(n)=500x=59sample proportion(p^)=xn=59500=0.118
Q: The data from car crash tests for four different vehicle size categories (Small, Midsize, Large, and…
A: The one-way Analysis of Variance output is given.
Q: Let X1∼Bin(n,p), where n=21 and p=(2)/20, What is P(X1≥5)? Round your answer to three significant…
A: Givenn=21p=220=0.1Let X1~Bin(n,p)P(X=x)=(nx)×px×(1-p)n-x ; x=0,1,...,n
Q: s question in R programming
A: The n trials and x successes The binomial distribution is given as: p(x) = nx px qn-x q = 1-p n = 25…
Q: How does Alex Smith, quarterback for the Kansas City Chiefs, compare to Joe Flacco, quarterback for…
A:
Q: A professor wants to know whether or not there is a difference in comprehension of a lab assignment…
A: The data shows the scores the students received on a test given after the lab.
Q: A hospital in a large city records the weight of every infant born at the hospital. The distribution…
A: Since posted multiple questions, answering only first three sub parts, please repost the remaining.…
Q: Number of Farms A random sample of the number of farms (in thousands) in various states follows.…
A: Given data is7,68,16,48,79,44,49,3,90,80,9,57,8,4,64,33,54,95,47,50,40,109sample size(n)=22standard…
Q: (d) The insurance company is considering seeking repayment from 1000 claims filed with Jocko's last…
A: Given that insurance adjusters are concerned about the high estimates they are receiving from…
Q: Suppose you are given the Ho: p=1.75 da: p=1.75 5% confidence interval is 1.80 μ< 1.90. ch of the…
A: Solution: To test the hypothesis Ho:μ=1.75 Vs Ha:μ≠1.75
Q: A university interested in tracking its honors program believes that the proportion of graduates…
A: A university interested in tracking its honors program believes that the proportion of graduates…
Q: a. Test the claim using a hypothesis test. Consider the first sample to be the sample of people over…
A: Given that, The two populations are the number of peoples who dream in black and white instead of…
Q: 2. The College Board reports that in 2017, the mean math score was 544 and the standard deviation…
A:
Q: Listed the accompanying table are waiting times (seconds) of observed cars at a Delaware inspection…
A: The following information has been provided: One Line Two line 64.3 63.8 156.5 215.6 142.2…
Q: Two different simple random samples are drawn from two different populations. The first sample…
A:
b. Find the equation of regression line between radiation doses on exposure time .using
least square method.
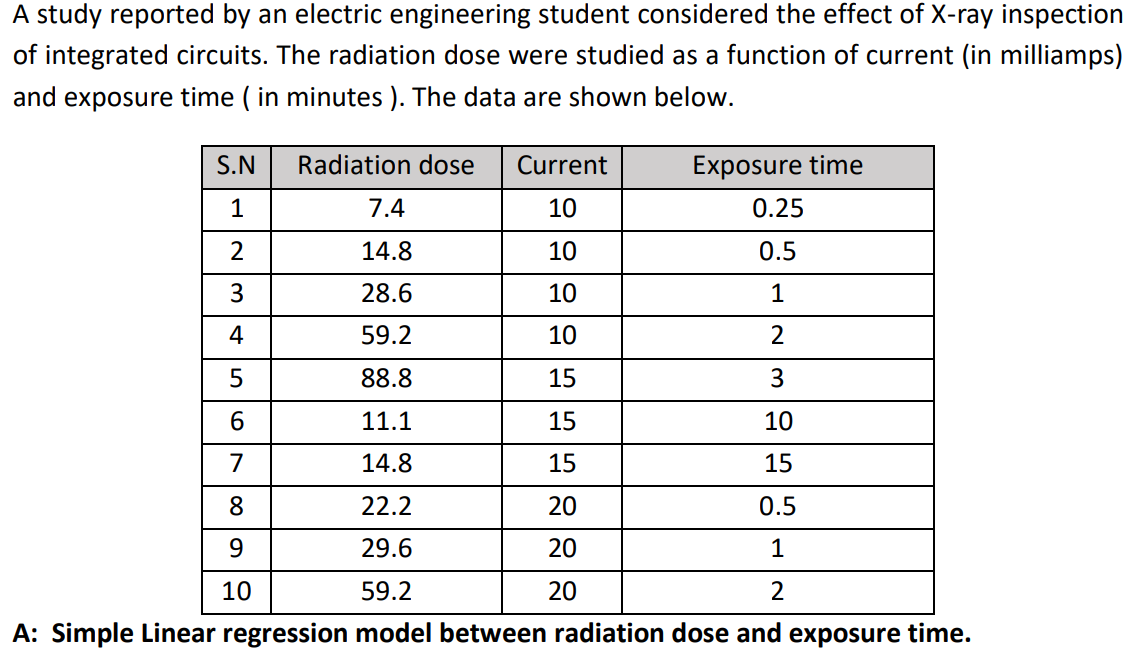
Trending now
This is a popular solution!
Step by step
Solved in 3 steps
- Olympic Pole Vault The graph in Figure 7 indicates that in recent years the winning Olympic men’s pole vault height has fallen below the value predicted by the regression line in Example 2. This might have occurred because when the pole vault was a new event there was much room for improvement in vaulters’ performances, whereas now even the best training can produce only incremental advances. Let’s see whether concentrating on more recent results gives a better predictor of future records. (a) Use the data in Table 2 (page 176) to complete the table of winning pole vault heights shown in the margin. (Note that we are using x=0 to correspond to the year 1972, where this restricted data set begins.) (b) Find the regression line for the data in part ‚(a). (c) Plot the data and the regression line on the same axes. Does the regression line seem to provide a good model for the data? (d) What does the regression line predict as the winning pole vault height for the 2012 Olympics? Compare this predicted value to the actual 2012 winning height of 5.97 m, as described on page 177. Has this new regression line provided a better prediction than the line in Example 2?The Update to the Task Force Report on Blood Pressure Control in Children [12] reported the observed 90th per-centile of SBP in single years of age from age 1 to 17 based on prior studies. The data for boys of average height are given in Table 11.18. Suppose we seek a more efficient way to display the data and choose linear regression to accomplish this task. age sbp 1 99 2 102 3 105 4 107 5 108 6 110 7 111 8 112 9 114 10 115 11 117 12 120 13 122 14 125 15 127 16 130 17 132 Do you think the linear regression provides a good fit to the data? Why or why not? Use residual analysis to justify your answer. Am I supposed to run a residual plot and QQ-plot for this question?Which of the multivariate regression parameters listed below would be best interpreted as: the predicted value on the dependent variable when all of the independent variables in the model are equal to zero. a b1 X1 R2
- The owner of Showtime Movie Theaters, Inc., would like to predict weekly gross revenueas a function of advertising expenditures. Historical data for a sample of eight weeks follow. Weekly GrossRevenue($1000s) Television Advertising($1000s) Newspaper Advertising($1000s) 96 5.0 1.5 90 2.0 2.0 95 4.0 1.5 92 2.5 2.5 95 3.0 3.3 94 3.5 2.3 94 2.5 4.2 94 3.0 2.5 a. Develop an estimated regression equation with the amount of televisionadvertising as the independent variable.b. Develop an estimated regression equation with both television advertising and newspaper advertising as the independent variables. c. Is the estimated regression equation coefficient for television advertisingexpenditures the same in part (a) and in part (b)? Interpret the coefficient in each case. d. Predict weekly gross revenue for a week when $3500 is spent on television advertising and $1800 is spent on newspaper advertising.Life insurance companies are keenly interested in predicting how long their customers are likely to live, because this will determine their premiums and ultimately their profitability. An Australian life insurance company is interested in the relationship, if any, between the age at death of their male customers and that of the customer’s father. Data are collected on a random sample of 100 of their male customers who have recently died. The customer’s age at death was plotted against that of their father and a linear regression model applied. Relevant output is shown below. Say how you know from the output that there actually is a significant linear relationship between a male customer’s age at death and his father’s age at death. State the value of the coefficient of Father’s Age (Death) and interpret this value in the context of the problem at hand.State the value of the coefficient of determination in the model and interpret this value in the context of the situation.Life insurance companies are keenly interested in predicting how long their customers are likely to live, because this will determine their premiums and ultimately their profitability. An Australian life insurance company is interested in the relationship, if any, between the age at death of their male customers and that of the customer’s father. Data are collected on a random sample of 100 of their male customers who have recently died. The customer’s age at death was plotted against that of their father and a linear regression model applied. Relevant output is shown below Examine both the scatterplot and the correlation matrix provided above. Comment on the apparent relationship between the customer’s age at death and their father’s age at death in the plot. Explain how the information in the correlation matrix supports your conclusion
- In an attempt to develop a model of wine quality as judged by wine experts, data on alcohol content and wine quality was collected from variants of a particular wine. From a sample of 17 wines, a model was created using the percentages of alcohol to predict wine quality. From the results of that regression, b1=0.4386 and Sb1=0.1141. a. At the 0.05 level of significance, is there evidence of a linear relationship between the percentage of alcohol and wine quality? b. Construct a 95% confidence interval estimate of the population slope, β1. b. The 95% confidence interval is __ ≤ β1 ≤ __ (Round to three decimal places as needed.)A fast-food chain decided to carry out an experiment to assess the influence of advertising expenditure on sales. Different relative changes in advertising expenditure, compared to the previous year, were made in eight regions of the country, and resulting changes in sales levels were observed the accompanying table shows the results. Increase in advertising expenditure (%) 0 5 15 20 25 30 35 40 Increase in sales (%) 5 10 18 25 35 50 60 65 Determine the value of regressions coefficients and write down the simple linear regression model.A researcher notes that, in a certain region, a disproportionate number of software millionaires were born around the year 1955. Is this a coincidence, or does birth year matter when gauging whether a software founder will besuccessful? The researcher investigated this question by analyzing the data shown in the accompanying table. Complete parts a through c below. a. Find the coefficient of determination for the simple linear regression model relating number (y) of software millionaire birthdays in a decade to total number (x) of births in the region. Interpret the result. The coefficient of determination is 1.___? (Round to three decimal places as needed.) This value indicates that 2.____ of the sample variation in the number of software millionaire birthdays is explained by the linear relationship with the total number of births in the region. (Round to one decimal place as needed.) b. Find the coefficient of determination for the simple linear regression model…
- Define the ADL and GLS Estimators of Regression.An experiment was carried out to observe the relationship between the time (Y) necessary for a vendor to supply a showcase in a store with sodas, and the boxes of product supplied (X), the information recorded is as follows (image) From the data: a. Get the fitted simple linear regression model b. Construct a scatterplot and discuss the result c. perform the analysis of variance. ThanksThe authors of a paper were interested in how the distance a deer mouse will travel for food is related to the distance from the food to the nearest pile of debris. Distances were measured in meters. The data and computer output are given below. Distance from Debris Distance Traveled 6.94 0.00 5.23 6.13 5.21 11.29 7.10 14.35 8.16 12.03 5.50 22.72 9.19 20.11 9.05 26.16 9.36 30.65 Simple Linear Regression Results: Dependent Variable: Traveled Independent Variable: Debris Sample size: 9 R (correlation coefficient) = 0.5657 R-sq = 0.32002088 Estimate of error standard deviation 8.670711 Parameter estimates: Parameter Estimate Std. Err. Alternative DF T-Stat P-Value Intercept -7.6854587 13.332196 ≠ 0 7 -0.5764586 0.5824 Slope 3.2340908 1.7818117 ≠ 0 7 1.8150575 0.1124 a)What is the least squares regression line for the output given above? b) what is the predicted traveled distance given the distance from debris is 6.5 meters?