A study used logistic regression to determine characteristics associated with Y = whether a cancer patient achieved remission (1 = yes). The most important explanatory variable was a labeling index (LI) that measures proliferative activity of cells after a patient receives an injection of tritiated thymidine. It represents the percentage of cells that are “labeled.” Table 1 shows the grouped data. Software reports Table 2 for a logistic regression model using LI to predict π = P(Y = 1). Using information from Table 2, conduct a Wald test for the LI effect and Interpret. Using information from Table 2, construct a Wald confidence interval for the odds ratio corresponding to a 1-unit increase in LI and interpret. Using information from Table 2, conduct a likelihood-ratio test for the LI effect and interpret. Using information from Table 2, construct the likelihood-ratio confidence interval for the odds ratio and interpret.
A study used logistic regression to determine characteristics associated with Y = whether a cancer patient achieved remission (1 = yes). The most important explanatory variable was a labeling index (LI) that measures proliferative activity of cells after a patient receives an injection of tritiated thymidine. It represents the percentage of cells that are “labeled.” Table 1 shows the grouped data. Software reports Table 2 for a logistic regression model using LI to predict π = P(Y = 1). Using information from Table 2, conduct a Wald test for the LI effect and Interpret. Using information from Table 2, construct a Wald confidence interval for the odds ratio corresponding to a 1-unit increase in LI and interpret. Using information from Table 2, conduct a likelihood-ratio test for the LI effect and interpret. Using information from Table 2, construct the likelihood-ratio confidence interval for the odds ratio and interpret.

Algebra & Trigonometry with Analytic Geometry
13th Edition
ISBN:9781133382119
Author:Swokowski
Publisher:Swokowski
Chapter10: Sequences, Series, And Probability
Section10.8: Probability
Problem 22E

Related questions
Question
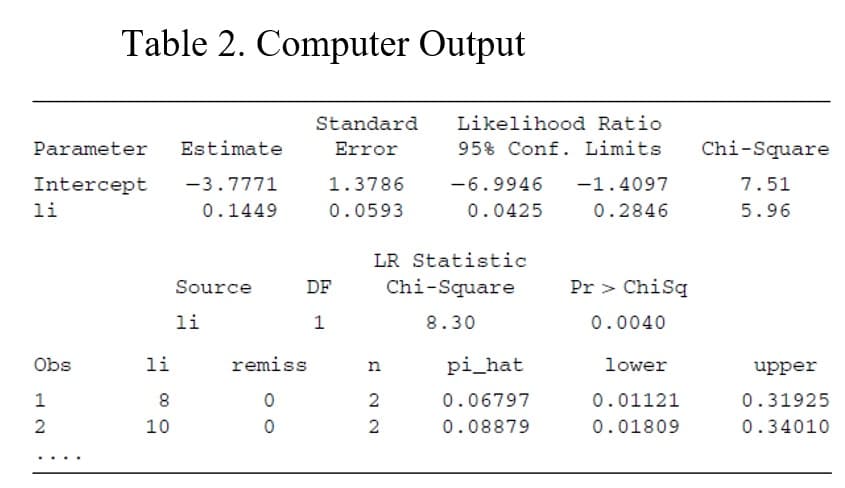
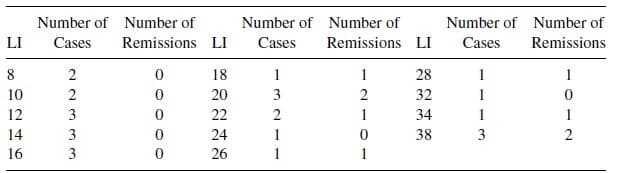
A study used logistic regression to determine characteristics associated with Y = whether a cancer patient achieved remission (1 = yes). The most important explanatory variable was a labeling index (LI) that measures proliferative activity of cells after a patient receives an injection of tritiated thymidine. It represents the percentage of cells that are “labeled.” Table 1 shows the grouped data. Software reports Table 2 for a logistic regression model using LI to predict π = P(Y = 1).
- Using information from Table 2, conduct a Wald test for the LI effect and Interpret.
- Using information from Table 2, construct a Wald confidence interval for the odds ratio corresponding to a 1-unit increase in LI and interpret.
- Using information from Table 2, conduct a likelihood-ratio test for the LI effect and interpret.
- Using information from Table 2, construct the likelihood-ratio confidence interval for the odds ratio and interpret.
Transcribed Image Text:Parameter Estimate
Intercept
-3.7771
0.1449
li
Table 2. Computer Output
Obs
1
2
li
8
10
Source
li
Standard
Error
remiss
0
0
1.3786
0.0593
DF
1
n
LR Statistic
Chi-Square
8.30
22
2
Likelihood Ratio
95% Conf. Limits
2
-6.9946 -1.4097
0.0425
0.2846
pi_hat
0.06797
0.08879
Pr > ChiSq
0.0040
lower
0.01121
0.01809
Chi-Square
7.51
5.96
upper
0.31925
0.34010
Transcribed Image Text:Number of Number of
LI Cases Remissions
82246
10
12
14
16
2333N
0
0
0
0
0
LI
18
20
22
24
26
Number of Number of
Cases
Remissions
1
3
2
1
1
1
2
1
0
1
LI
28
32
34
38
Number of Number of
Cases
Remissions
1
1
1
3
1
0
1
2
Expert Solution
This question has been solved!
Explore an expertly crafted, step-by-step solution for a thorough understanding of key concepts.

This is a popular solution!

Trending now
This is a popular solution!

Step by step
Solved in 4 steps with 5 images

Recommended textbooks for you
Algebra & Trigonometry with Analytic Geometry
Algebra
ISBN:
9781133382119
Author:
Swokowski
Publisher:
Cengage
Algebra & Trigonometry with Analytic Geometry
Algebra
ISBN:
9781133382119
Author:
Swokowski
Publisher:
Cengage