A study was done on body temperatures of men and women. The results are shown in the table. Assume that the two samples are independent simple random samples selected from normally distributed populations, and do not assume that the population standard deviations are equal. Complete parts (a) and (b) below. Men Women μ μ1 μ2 n 11 59 x 97.72 degrees°F 97.39degrees °F s 0.88 degrees°F 0.68 degrees °F a. Use a 0.05 0.05 significance level to test the claim that men have a higher mean body temperature than women. What are the null and alternative hypotheses? A. Upper H 0 H0: mu 1 μ1 equals = mu 2 μ2 Upper H 1 H1: mu 1 μ1 not equals ≠ mu 2 μ2 B. Upper H 0 H0: mu 1 μ1 greater than or equals ≥ mu 2 μ2 Upper H 1 H1: mu 1 μ1 less than < mu 2 μ2 C. Upper H 0 H0: mu 1 μ1 not equals ≠ mu 2 μ2 Upper H 1 H1: mu 1 μ1 less than < mu 2 μ2 D. Upper H 0 H0: mu 1 μ1 equals = mu 2 μ2 Upper H 1 H1: mu 1 μ1 greater than > mu 2 The test statistic, t, is ___ The P-value is ____ State the conclusion for the test. A. Reject the null hypothesis. There is not sufficient evidence to warrant rejection of the claim that men and women have the same mean BMI. B. Reject the null hypothesis. There is sufficient evidence to warrant rejection of the claim that men and women have the same mean BMI. C. Fail to reject the null hypothesis. There is sufficient evidence to warrant rejection of the claim that men and women have the same mean BMI. D.Fail to reject the null hypothesis. There is not sufficient evidence to warrant rejection of the claim that men and women have the same mean BMI. b. Construct a confidence interval suitable for testing the claim that males and females have the same mean BMI. ___< μ1 - μ2<___ (Round to three decimal places as needed.) Does the confidence interval support the conclusion of the test? _____ because the confidence interval contains____


|
A study was done on body temperatures of men and women. The results are shown in the table. Assume that the two samples are independent simple random samples selected from |
|
Men |
Women |
|
|
μ |
μ1 |
μ2 |
|
|
n |
11 |
59 |
|
|
x |
97.72 degrees°F |
97.39degrees °F |
|
|
s |
0.88 degrees°F |
0.68 degrees °F |
a. Use a
0.05
0.05 significance level to test the claim that men have a higher mean body temperature than women.
What are the null and alternative hypotheses?
A.
Upper H 0
H0:
mu 1
μ1
equals
=
mu 2
μ2
Upper H 1
H1:
mu 1
μ1
not equals
≠
mu 2
μ2
B.
Upper H 0
H0:
mu 1
μ1
greater than or equals
≥
mu 2
μ2
Upper H 1
H1:
mu 1
μ1
less than
<
mu 2
μ2
C.
Upper H 0
H0:
mu 1
μ1
not equals
≠
mu 2
μ2
Upper H 1
H1:
mu 1
μ1
less than
<
mu 2
μ2
D.
Upper H 0
H0:
mu 1
μ1
equals
=
mu 2
μ2
Upper H 1
H1:
mu 1
μ1
greater than
>
mu 2
The test statistic, t, is ___
The P-value is ____
State the conclusion for the test.
A. Reject the null hypothesis. There is not sufficient evidence to warrant rejection of the claim that men and women have the same mean BMI.
B. Reject the null hypothesis. There is sufficient evidence to warrant rejection of the claim that men and women have the same mean BMI.
C. Fail to reject the null hypothesis. There is sufficient evidence to warrant rejection of the claim that men and women have the same mean BMI.
D.Fail to reject the null hypothesis. There is not sufficient evidence to warrant rejection of the claim that men and women have the same mean BMI.
b. Construct a confidence interval suitable for testing the claim that males and females have the same mean BMI.
___< μ1 - μ2<___
(Round to three decimal places as needed.)
Does the confidence interval support the conclusion of the test?
_____ because the confidence interval contains____
(a)
State the hypotheses.
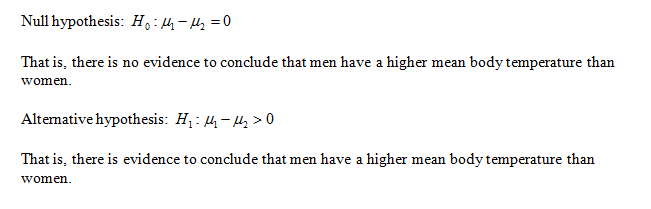
Correct option: Option D
Obtain the value of the test statistic.
The value of the test statistic is obtained below as follows :
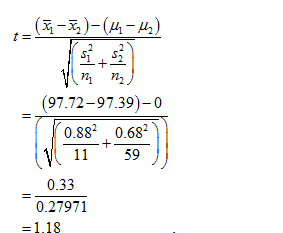
Thus, the value of the test statistic is 1.18.

Trending now
This is a popular solution!

Step by step
Solved in 4 steps with 7 images


