A study was done over a five-year period to determine if the average t number of ticket sales. The data is summarized below. Find the equati Average Ticket Number of Sales Price (in billions) (in dollars) $2.75 1.4 $3.25 1.2 $3.50 1.8 $4.75 1.7 $6.25 1.9 $6.75 2.0
A study was done over a five-year period to determine if the average t number of ticket sales. The data is summarized below. Find the equati Average Ticket Number of Sales Price (in billions) (in dollars) $2.75 1.4 $3.25 1.2 $3.50 1.8 $4.75 1.7 $6.25 1.9 $6.75 2.0

Chapter4: Linear Functions
Section: Chapter Questions
Problem 41RE: For the following exercises, consider the data in Table 5, which shows the percent of unemployed in...

Related questions
Question
Answer two questions in the picture from these four options.
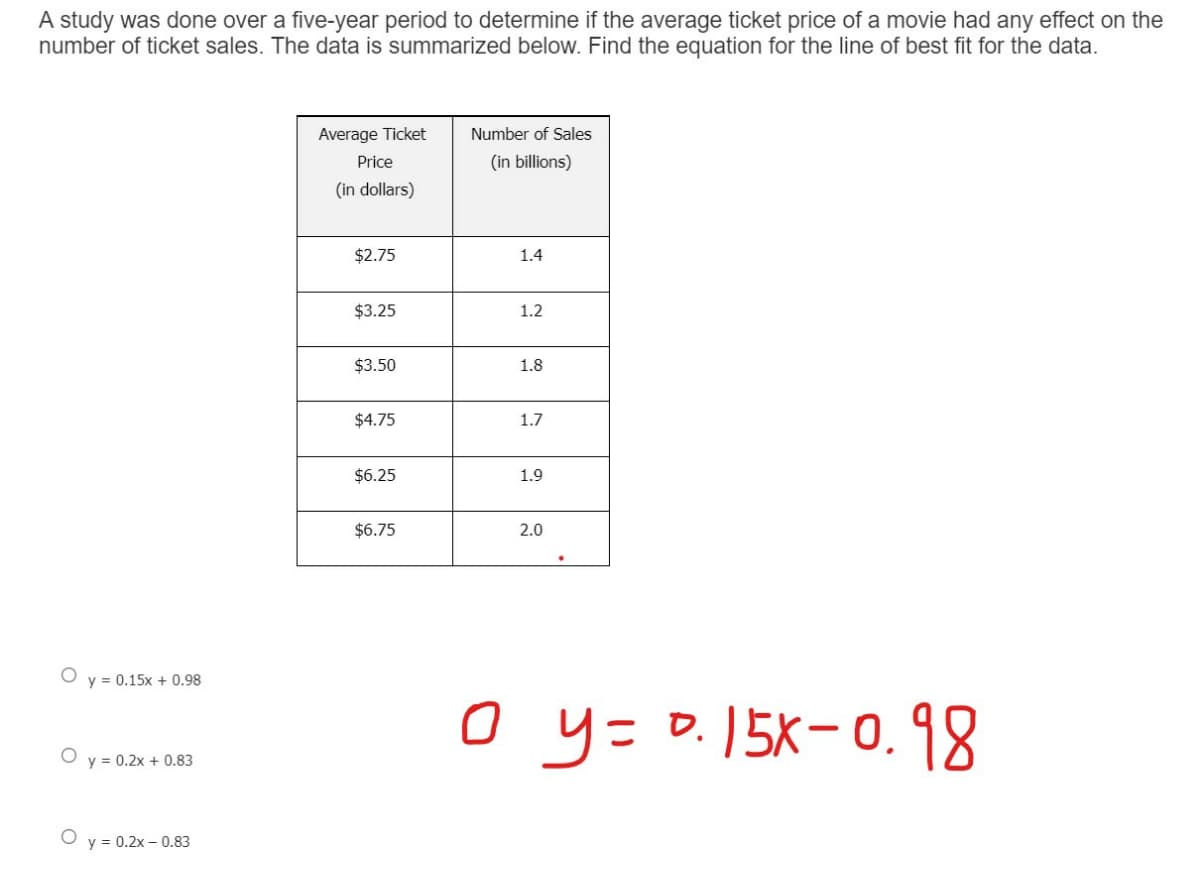
Transcribed Image Text:A study was done over a five-year period to determine if the average ticket price of a movie had any effect on the
number of ticket sales. The data is summarized below. Find the equation for the line of best fit for the data.
Average Ticket
Number of Sales
Price
(in billions)
(in dollars)
$2.75
1.4
$3.25
1.2
$3.50
1.8
$4.75
1.7
$6.25
1.9
$6.75
2.0
y = 0.15x + 0.98
y= D.15X-0.98
O y = 0.2x + 0.83
O y = 0.2x – 0.83
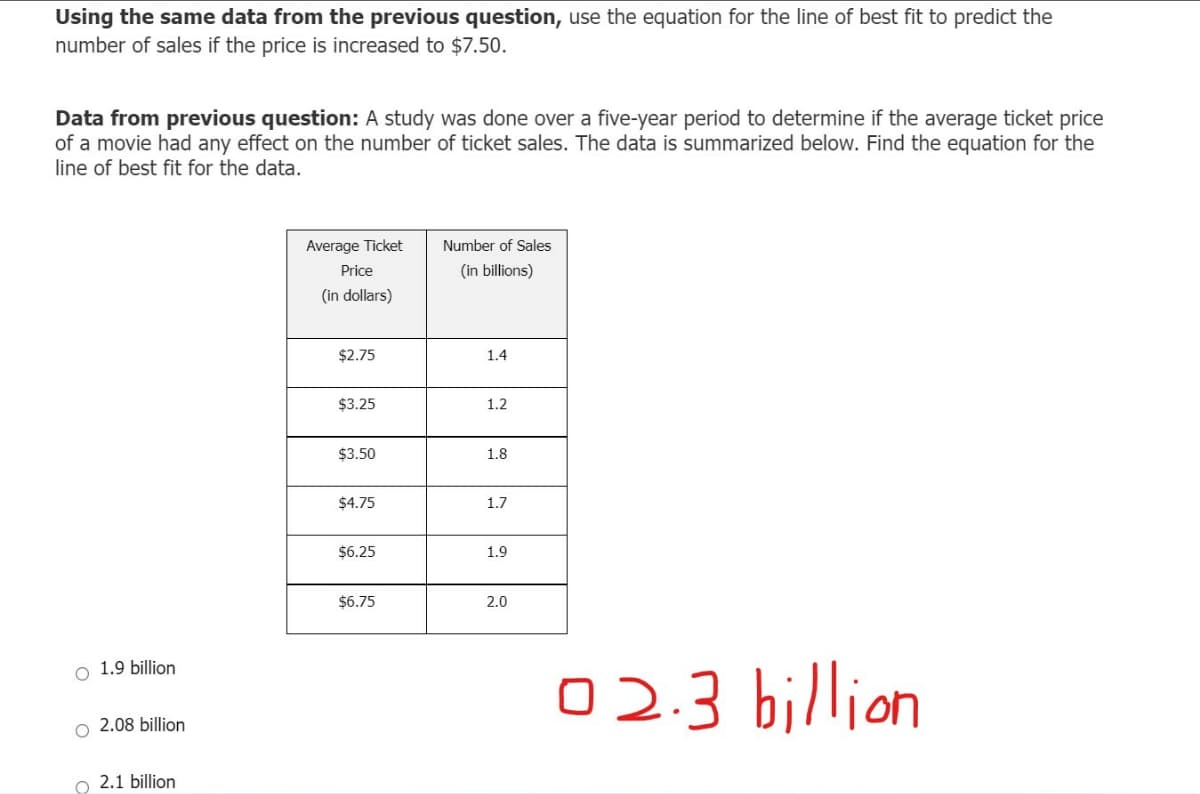
Transcribed Image Text:Using the same data from the previous question, use the equation for the line of best fit to predict the
number of sales if the price is increased to $7.50.
Data from previous question: A study was done over a five-year period to determine if the average ticket price
of a movie had any effect on the number of ticket sales. The data is summarized below. Find the equation for the
line of best fit for the data.
Average Ticket
Number of Sales
Price
(in billions)
(in dollars)
$2.75
1.4
$3.25
1.2
$3.50
1.8
$4.75
1.7
$6.25
1.9
$6.75
2.0
O 1.9 billion
02.3 billion
o 2.08 billion
o 2.1 billion
Expert Solution
This question has been solved!
Explore an expertly crafted, step-by-step solution for a thorough understanding of key concepts.

This is a popular solution!

Trending now
This is a popular solution!

Step by step
Solved in 4 steps

Recommended textbooks for you

Algebra & Trigonometry with Analytic Geometry
Algebra
ISBN:
9781133382119
Author:
Swokowski
Publisher:
Cengage

College Algebra
Algebra
ISBN:
9781305115545
Author:
James Stewart, Lothar Redlin, Saleem Watson
Publisher:
Cengage Learning
Algebra & Trigonometry with Analytic Geometry
Algebra
ISBN:
9781133382119
Author:
Swokowski
Publisher:
Cengage
College Algebra
Algebra
ISBN:
9781305115545
Author:
James Stewart, Lothar Redlin, Saleem Watson
Publisher:
Cengage Learning

Algebra and Trigonometry (MindTap Course List)
Algebra
ISBN:
9781305071742
Author:
James Stewart, Lothar Redlin, Saleem Watson
Publisher:
Cengage Learning

Algebra: Structure And Method, Book 1
Algebra
ISBN:
9780395977224
Author:
Richard G. Brown, Mary P. Dolciani, Robert H. Sorgenfrey, William L. Cole
Publisher:
McDougal Littell

Linear Algebra: A Modern Introduction
Algebra
ISBN:
9781285463247
Author:
David Poole
Publisher:
Cengage Learning