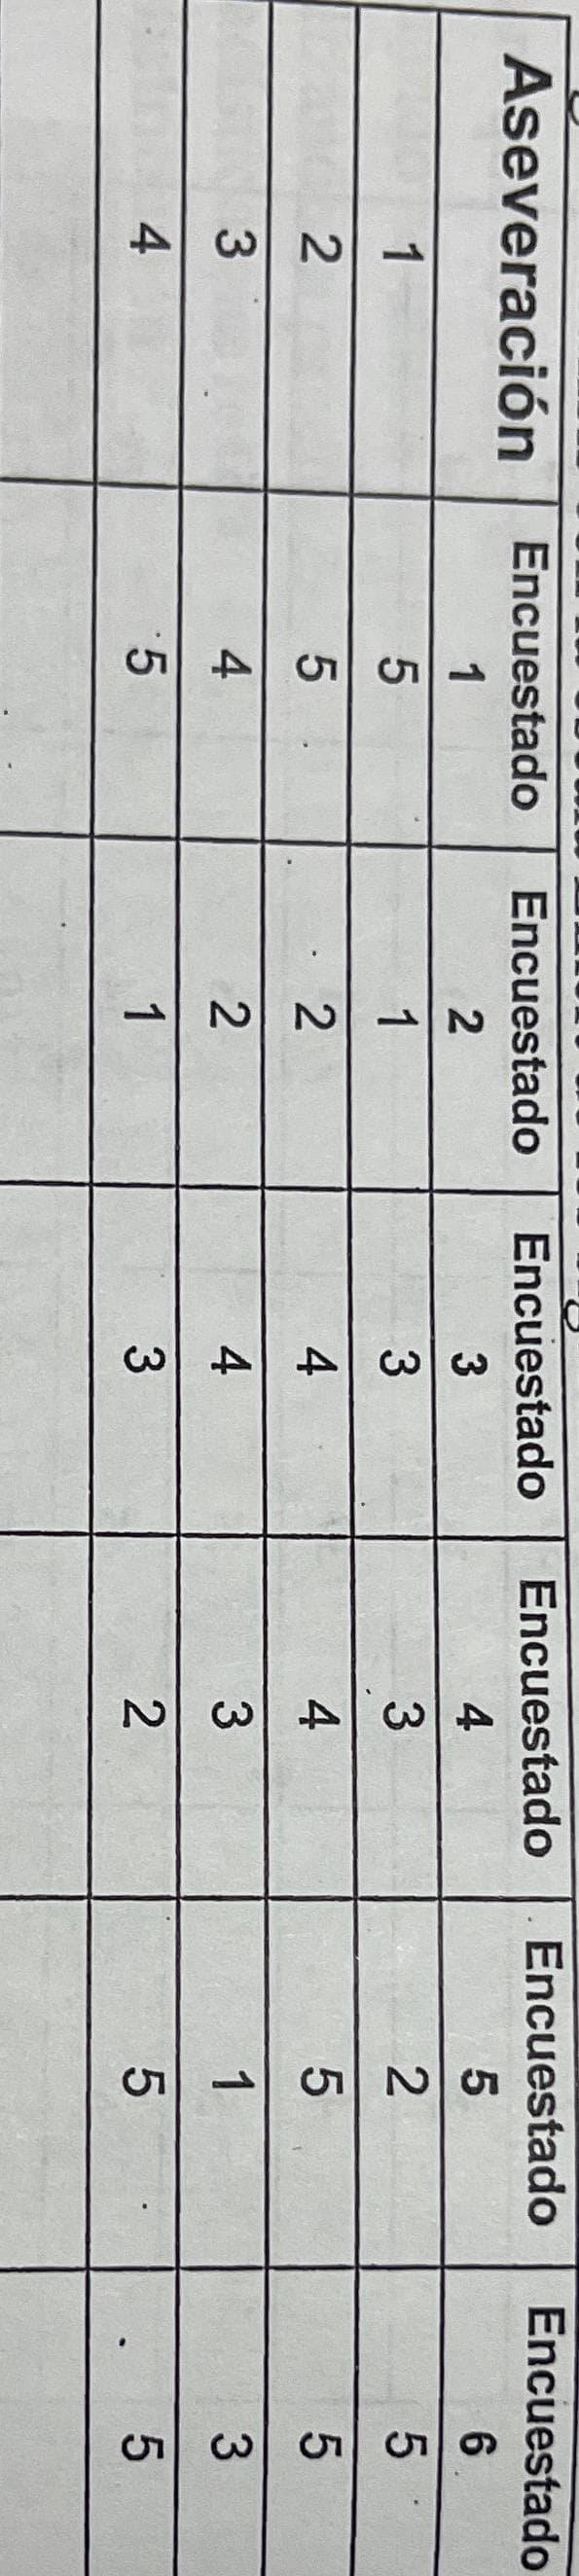
Make the analysis with the Likert scale of the following data


Q: ects several samples from the manufacturer and records the following learned in Forecasting,…
A: Given: The data given is as shown below Temperature (x) Strength (y) 185 5150 183 5125 187…
Q: Find the range for the given data. The amount that Jeremy has saved in each of the last six months…
A: From the given information, the minimum value is 113 and the maximum value is 655.
Q: Which of the following graphs is not useful for displaying the distribution of the data? Box plot…
A: We have to find correct answer for question.....
Q: fraction defective is to be maintained at 0.02, construct a P-chart for these data.
A:
Q: Determine the range of the following raw data. Write your solution.
A: A measure of variability is a summary statistic that represents the amount of dispersion in a…
Q: The nine measurements that follow are furnace temperatures recorded on successive batches in a…
A: Option a is correct. The sample mean is calculated by the formula x_bar=∑iX_in wher X_i are the…
Q: Find the mean for the data items in the given frequency distribution. Score, x Frequency, f 1 3 4 7…
A: The data is, Score 1 2 3 4 5 6 7 8 Frequency 3 2 4 3 4 5 4 2
Q: Determine the value of f(16) for a given set of data b
A: Given: From the following table the value of x and fx is,
Q: Calculate the range for the time taken for a client to buy your product using this data. 45, 32, 29,…
A: given data;45,32,29,63,15,15data in ascending order;15,15,29,32,45,63
Q: Determine the value of x from the data given below if the ratio between the Laspeyre's index number…
A:
Q: The nine measurements that follow are furnace temperatures recorded on successive batches in a…
A: Given
Q: fined as the percentage of a specified number of se he following data for time
A: Given ,
Q: ntify the t-value of the percentiles of the following by filling up the table Student t-value 1.…
A: Given that, A researcher conducts a diagnostic examination to 20 students. The following are the…
Q: е. Find her percentile scores for the two exams. (use R-code)
A: The score of Mathematics is 94.6 and the score of Physics is 93.7 Mean score of mathematics 86.1…
Q: Given the following data, find the value of D3
A:
Q: 16 30
A: In a right angle triangle, the longest side is called hypotenuse. The side which is opposite to the…
Q: The following data is for the first quiz and second quiz scores. Predict the value of the second…
A: Given data, X Y X*Y X*X 10 9 90 100 11 12 132 121 15 14 210 225 22 18 396 484
Q: From the data given below, find out the value of Y when X = 35 10 20 30 40 Y 50 60 70 90
A: Given data is X 10 20 30 40 Y 50 60 70 90
Q: Calculate (x-bar) for the data shown, to two decimal places
A: Calculate Mean from the following data17.9,2.6,6.3,16.4,24.2,26.1,18.7,18.4,9.1,5.7
Q: а. Construct an FDT for the data using five class intervals b. What the table tells you, what can…
A:
Q: a) Find the first quartile, Q1. b) Find the third quartile, Q3. c) Find the interquartile range.
A:
Q: The table below displays the number of cars ariving at a fuel station per hour on different times of…
A: Given data is1 , 6 , 6 , 21, 22,35,60,113, 178, 200sample size(n)=10
Q: For the distribution as shown: Determine the 6th decile
A: Given, class f cumulative frequency (cf) 3-6 4 4 6-9 10 10+4=14 9-12 12 14+12=26 12-15 9…
Q: nd the Median for the following data s Class Interval Frequency 0-10 28 10-20 36
A: For the calculation of the medina, we will first obtain the cumulative frequencies. The table shows…
Q: The nine measurements that follow are furnace temperatures recorded on successive batches in a…
A: Box plot are used to measure the spread and skewness of the data set. It is also used to measure the…
Q: Complete the following statements: 1. In general, _________% of the values in a data set lie at or…
A: Solution : Definition of percentile - The percentile indicates the values below which given…
Q: Based on the diagram below make a flowchart for a t test for a mean.
A: Given:
Q: Using this formula and other formulas, find Q1, 2, Qz, the midquartile, and the interquartile range…
A: It is given that Q1 = 60, Q2 = 92 and Q3 = 101
Q: Look at the data below. 2 337 11 11 16 What is the interquartile range of the data? 07 0 8 o 11 o 14
A:
Q: State whether the data below are discrete or continuous, explain why. The time(in minutes) it takes…
A: It is given that the time (in minutes) it takes different students to drive to school from home.
Q: Q3 (d): Is the empirical relation among Mean, Median and Mode can * ?be applied for this data
A: It is given that the data follows asymmetrical skewed distribution.
Q: Use the sample of grades on the right for the following. a. Make a stem and leaf plot. 1. b. Make a…
A: As per our guidelines, we are allowed to answer first three sub-parts only. Thanks Given Data :…
Q: Determine the value of y for x = 2 , given the following data:
A:
Q: The mean GPA for a 127 residents of the local apartment complex is 1.6. What is the best point…
A: Assume that the random variable X defines the mean GPA for a randomly selected residents of the…
Q: Complete the following statements: 1. In general,________ % of the values in a data set lie at or…
A:
Q: Which of the following summary measures is affected by extreme values? Select one: a. The median.…
A: Range can be calculated as: Range =Maximum value - minimum value
Q: Use the accompanying data set to complete the following actions. a. Find the quartiles. b. Find the…
A: Given data is65,57,60,59,55,55,62,65,55,56,54,64,64,65,85Arrange the data in ascending…
Q: The following scatterplot and table represent the mean monthly temperature an rainfall of a coastal…
A: Temp (Co) Rainfall (mm) 18 45 15 20 19 50 25 115 22 65 24 100 28 300 26 190 27 175…
Q: HW.1 X y 58 Find y. (10) for the following data in the below table. 6 9 14 17 10
A: We will use Lagrange's Interpolating polynomial to find y10.
Q: e the leaves in the stem-and-leaf plot below. =33 orked est describes the data? Most nurses work…
A: For the given information/data, the stem and leaf plot is shown as follows: Hours worked…
Q: For which of the x-values should you NOT attempt to estimate the y because of extrapolation? 20 60…
A: Given Information: From the given graph, the data points are, 9,1,41,3,55,4,69,5,75,5,83,6
Q: h. Compute for the range of the data set.
A: here use given data of applicants and their respective score
Q: ose an antiquities store in Athens has a very old ma e of the type four short and one long. Do the…
A: Given, true proportion (p) = 21.4% = 0.214 sample size (n) = 484 x =127 sample proportion (p^) =…
Q: 2. For the above data draw frequency curve.
A:
Q: then your mean of grades=
A:
Q: 01 23 45 6 7 8 9 10 11 12 Runs ...
A: It is asked to find the range, median, and the first and third quartiles and the interquartile range…
Q: For these data, make a frequency table and calculate the average
A:
Q: ör the following data of tablet weights in a packet calculate the control limits for the range chart
A:
Q: The following numbers are chemical color measurements from a chemical company: a) About how many…
A: The box whisker plot is plot of quartile. It is used to measure the distribution of observation and…
Q: Use the dot plots to find the mean, median, and IQR of each class. Round to 1 decimal place, if…
A: There are two classes A and B having the dot plots.
Make the analysis with the Likert scale of the following data

Step by step
Solved in 2 steps with 1 images

- A machine puts out 16 imperfect articles in a sample of 500. After the machine is over-hauled, it puts out 3 imperfect articles in a batch of 100. Has the machine improved?Ninety percent of the people who have a particular disease will have a positive result on a given diagnostic test. Ninety percent of the people who do not have the disease will have a negative on this test. If 7 percent of a certain populaton has the disease, what percent of that population would test positive for the diesase?The quality inspector of a certain factory states that 3% of outgoing products have major defects. A sample of 200 products have 5 defective products. Is there strong evidence that the statement of the quality inspector is true? Use α = 0.05
- Find the chances that at least two people in our class (n=66) have the same birthday (MM/DD)?A drug company is developing a new pregnancy-test kit for use on an outpatient basis. The company uses the pregnancy test on 100 women who are known to be pregnant, for whom 95 test results are positive. The company uses the pregnancy test on 100 other women who are known to not be pregnant, of whom 99 test negative.A medical researcher says that less than 74%of adults in a certain country think that healthy children should be required to be vaccinated. In a random sample of 600adults in that country, 71% think that healthy children should be required to be vaccinated. At α=0.01, is there enough evidence to support the researcher's claim? Complete parts (a) through (e) below. (a) Identify the claim and state H0 andHa. Identify the claim in this scenario. Select the correct choice below and fill in the answer box to complete your choice. (Type an integer or a decimal. Do not round.) Fill the percentage on the correct answer A. % of adults in the country think that healthy children should be required to be vaccinated. B. Less than %of adults in the country think that healthy children should be required to be vaccinated. C. The percentage of adults in the country who think that healthy children should be required to be vaccinated is not %. D. More than…
- A research center claims that 29% of adults in a certain country would travel into space on a commercial flight if they could afford it. In a random sample of 800 adults in that country, 31% say that they would travel into space on a commercial flight if they could afford it. At a=0.05, is there enough evidence to reject the research center's claim? Complete parts (a) through (d) below. (a) Identify the claim and state H0 and Ha. Identify the claim in this scenario. Select the correct choice below and fill in the answer box to complete your choice. (Type an integer or a decimal. Do not round.) A. The percentage of adults in the country who would travel into space on a commercial flight if they could afford it is not ______%. B. No more than ______% of adults in the country would travel into space on a commercial flight if they could afford it. C. ______% of adults in the country would travel into space on a commercial flight if they could afford it. D. At least ______% of…A medical researcher says that less than 85% of adults in a certain country think that healthy children should be required to be vaccinated. In a random sample of 300 adults in that country, 83% think that healthy children should be required to be vaccinated. At α=0.01, is there enough evidence to support the researcher's claim? Complete parts (a) through (e) below. (a) Identify the claim and state H0 and Ha. Identify the claim in this scenario. Select the correct choice below and fill in the answer box to complete your choice. (Type an integer or a decimal. Do not round.) A. Less than enter your response here% of adults in the country think that healthy children should be required to be vaccinated. B. The percentage of adults in the country who think that healthy children should be required to be vaccinated is not enter your response here%. C. More than enter your response here% of adults in the country think that healthy children…A research center claims that 30% of adults in a certain country would travel into space on a commercial flight if they could afford it. In a random sample of 1100 adults in that country, 34% say that they would travel into space on a commercial flight if they could afford it. At α=0.05, is there enough evidence to reject the research center's claim? Complete parts (a) through (d) below. (a) Identify the claim and state H0 and Ha. Identify the claim in this scenario. Select the correct choice below and fill in the answer box to complete your choice. (Type an integer or a decimal. Do not round.) A. At least enter your response here% of adults in the country would travel into space on a commercial flight if they could afford it. B. 3030% of adults in the country would travel into space on a commercial flight if they could afford it. C. The percentage adults in the country who would travel into space on a commercial flight if they could…
- A research center claims that 30% of adults in a certain country would travel into space on a commercial flight if they could afford it. In a random sample of 1100 adults in that country, 34% say that they would travel into space on a commercial flight if they could afford it. At α=0.05, is there enough evidence to reject the research center's claim? Complete parts (a) through (d) below. (a) Identify the claim and state H0 and Ha. Identify the claim in this scenario. Select the correct choice below and fill in the answer box to complete your choice. (Type an integer or a decimal. Do not round.) A. At least enter your response here% of adults in the country would travel into space on a commercial flight if they could afford it. B. enter your response here% of adults in the country would travel into space on a commercial flight if they could afford it. C. The percentage adults in the country who would travel into space on a commercial…A research center claims that 26% of adults in a certain country would travel into space on a commercial flight if they could afford it. In a random sample of 1000 adults in that country, 29% say that they would travel into space on a commercial flight if they could afford it. At α=0.05, is there enough evidence to reject the research center's claim? Complete parts (a) through (d) below. (a) Identify the claim and state H0 and Ha. "Recall that the claim is the percentage of adults in the country would travel into space on a commercial flight if they could afford it. Let a success be an adult in the country who would travel into space on a commercial flight if they could afford it. Translate the claim made about the population parameter from a verbal statement to a mathematical statement." (b) Use technology to find the P-value. (c) Decide whether to reject or fail to reject the null hypothesis and (d) interpret the decision in the context of the original claim.A medical researcher says that less than 86% of adults in a certain country think that healthy children should be required to be vaccinated. In a random sample of 300 adults in that country, 84% think that healthy children should be required to be vaccinated. At α=0.05, is there enough evidence to support the researcher's claim? Complete parts (a) through (e) below. (a) Identify the claim and state H0 and Ha. Identify the claim in this scenario. Select the correct choice below and fill in the answer box to complete your choice. (Type an integer or a decimal. Do not round.) A. Less than 8686% of adults in the country think that healthy children should be required to be vaccinated. B. The percentage of adults in the country who think that healthy children should be required to be vaccinated is not nothing%. C. nothing% of adults in the country think that healthy children should be required to be vaccinated. D. More than nothing%…