a) suppose a student in 2007 estimated that her expenses were distributed among the CPI categories as listed in Table 5.6. (She had no housing expenses since she lived at home.) Calculate the inflation rate she would have experienced relative to the year before. b) compare the answer in (a) to the northeast urban average of 2.58% and explain why the rate the student experienced was higher or lower.
a) suppose a student in 2007 estimated that her expenses were distributed among the CPI categories as listed in Table 5.6. (She had no housing expenses since she lived at home.) Calculate the inflation rate she would have experienced relative to the year before. b) compare the answer in (a) to the northeast urban average of 2.58% and explain why the rate the student experienced was higher or lower.

Microeconomics A Contemporary Intro
10th Edition
ISBN:9781285635101
Author:MCEACHERN
Publisher:MCEACHERN
Chapter18: Income Distribution And Poverty
Section: Chapter Questions
Problem 4QFR

Related questions
Question
your rate may vary.
a) suppose a student in 2007 estimated that her expenses were distributed among the CPI categories as listed in Table 5.6. (She had no housing expenses since she lived at home.) Calculate the inflation rate she would have experienced relative to the year before.
b) compare the answer in (a) to the northeast urban average of 2.58% and explain why the rate the student experienced was higher or lower.
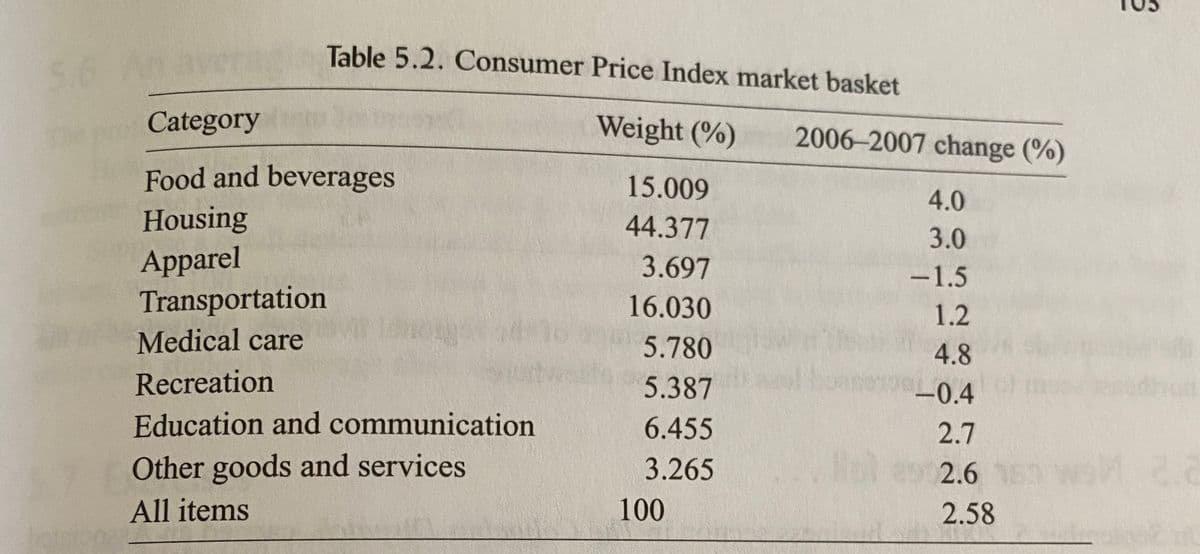
Transcribed Image Text:Table 5.2. Consumer Price Index market basket
5.6
Category
Weight (%)
2006-2007 change (%)
Food and beverages
15.009
4.0
Housing
Apparel
Transportation
Medical care
44.377
3.0
3.697
-1.5
16.030
1.2
5.780
4.8
Recreation
5.387
-0.4
Education and communication
6.455
2.7
Other goods and services
3.265
Hot 29 2.6 E3
All items
100
2.58
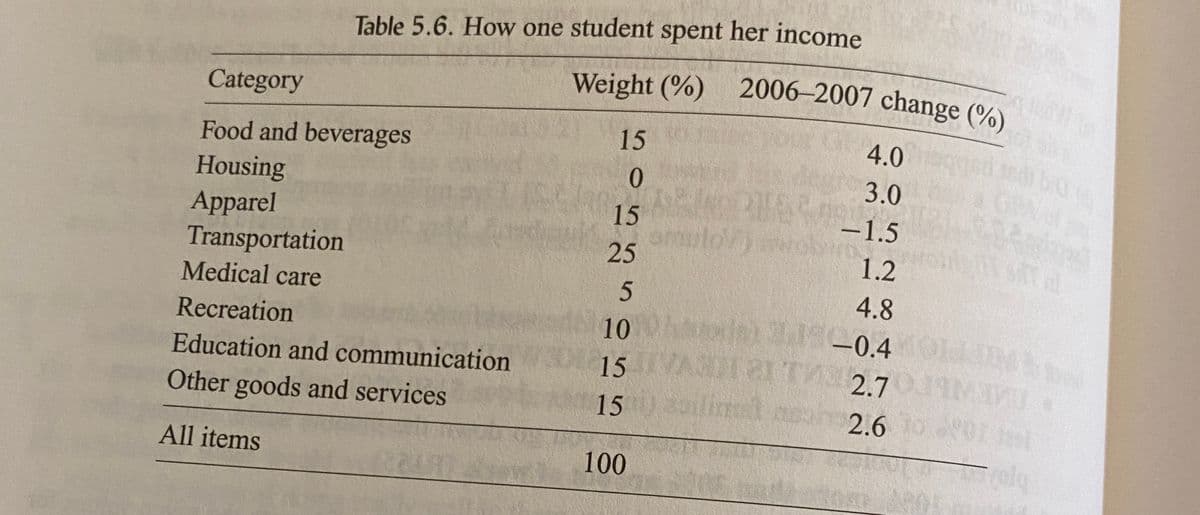
Transcribed Image Text:Weight (%) 2006–2007 change (%)
Table 5.6. How one student spent her income
Category
Food and beverages
15
4.0
0.
3.0
Housing
Apparel
Transportation
Medical care
15
-1.5
amu
ulov
25
1.2
5
4.8
1.190.4
VASUIRITAS 2.7 M
Recreation
-
Education and communication
15
Other goods and services
15
2.6
All items
100
olg
Expert Solution
This question has been solved!
Explore an expertly crafted, step-by-step solution for a thorough understanding of key concepts.

This is a popular solution!

Trending now
This is a popular solution!

Step by step
Solved in 2 steps

Recommended textbooks for you
