A survey includes demographic questions, such as, "How old are you?". The following chart summarizes the age-related information collected from the 449 respondents to the survey. Age < 20 Number of Customers 83 20-29 58 30-39 97 40-49 63 50-59 72 > 60 76 What is the probability that a randomly selected respondent is at least 40? (Round answers to 4 decimal places.)
A survey includes demographic questions, such as, "How old are you?". The following chart summarizes the age-related information collected from the 449 respondents to the survey. Age < 20 Number of Customers 83 20-29 58 30-39 97 40-49 63 50-59 72 > 60 76 What is the probability that a randomly selected respondent is at least 40? (Round answers to 4 decimal places.)

Chapter8: Sequences, Series,and Probability
Section8.7: Probability
Problem 11ECP: A manufacturer has determined that a machine averages one faulty unit for every 500 it produces....

Related questions

Concept explainers
Contingency Table
A contingency table can be defined as the visual representation of the relationship between two or more categorical variables that can be evaluated and registered. It is a categorical version of the scatterplot, which is used to investigate the linear relationship between two variables. A contingency table is indeed a type of frequency distribution table that displays two variables at the same time.
Binomial Distribution
Binomial is an algebraic expression of the sum or the difference of two terms. Before knowing about binomial distribution, we must know about the binomial theorem.
Topic Video
Question
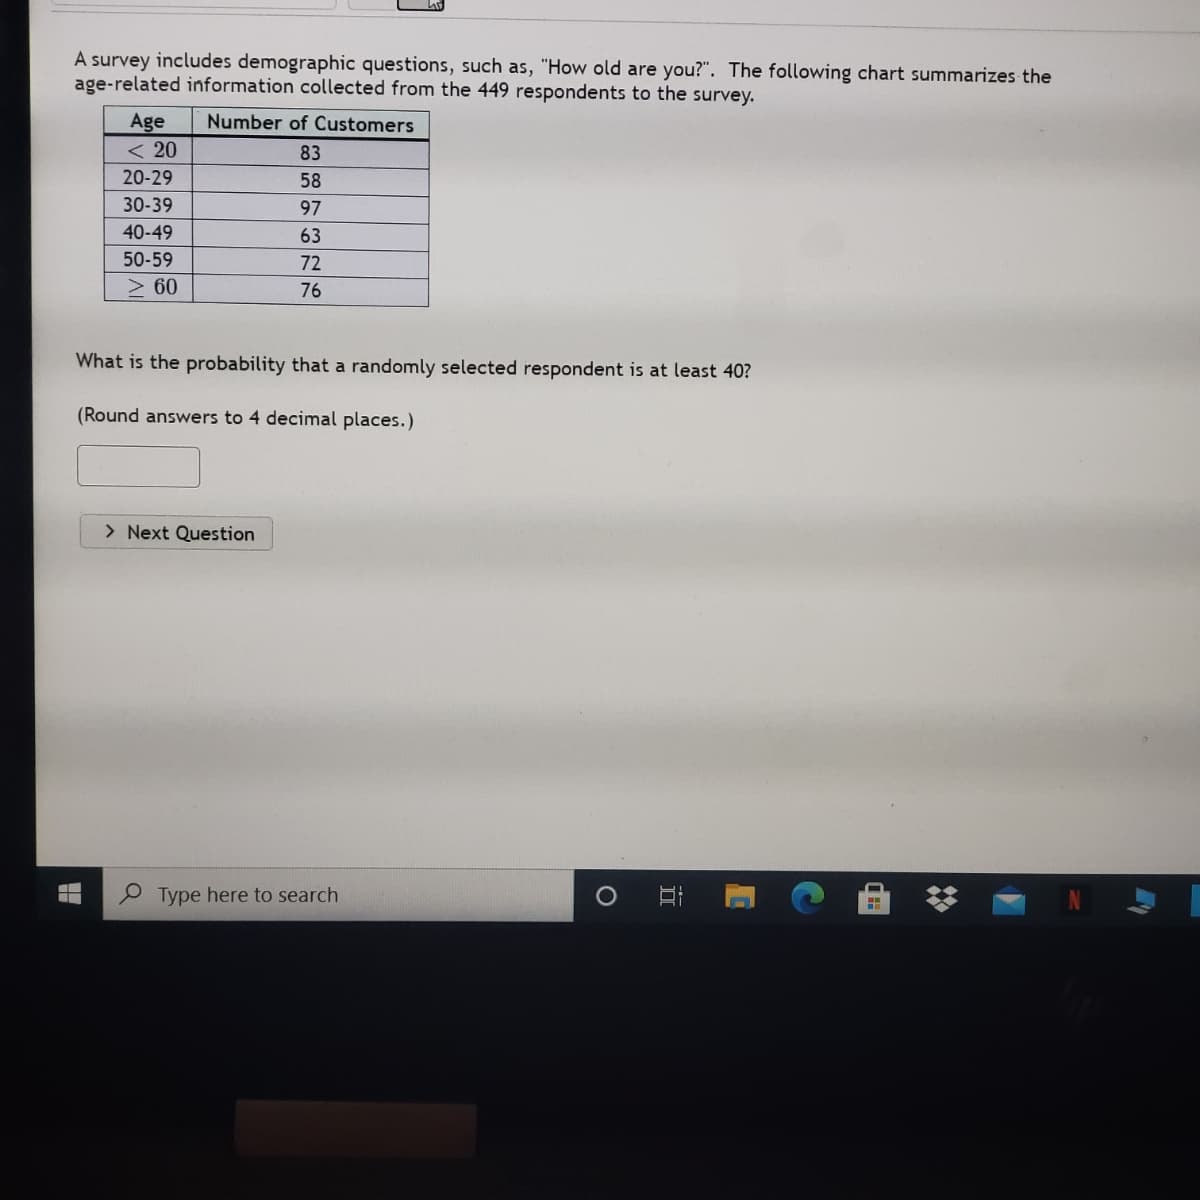
Transcribed Image Text:A survey includes demographic questions, such as, "How old are you?". The following chart summarizes the
age-related information collected from the 449 respondents to the survey.
IT
Age
< 20
Number of Customers
83
20-29
58
30-39
97
40-49
63
50-59
72
2 60
76
What is the probability that a randomly selected respondent is at least 40?
(Round answers to 4 decimal places.)
> Next Question
Type here to search
立
Expert Solution
Step 1
The table is:
| Age | Number of Customers |
| <20 | 83 |
| 20-29 | 58 |
| 30-39 | 97 |
| 40-49 | 63 |
| 50-59 | 72 |
| ≥60 | 76 |

Step by step
Solved in 2 steps

Knowledge Booster


Learn more about
Need a deep-dive on the concept behind this application? Look no further. Learn more about this topic, statistics and related others by exploring similar questions and additional content below.Recommended textbooks for you