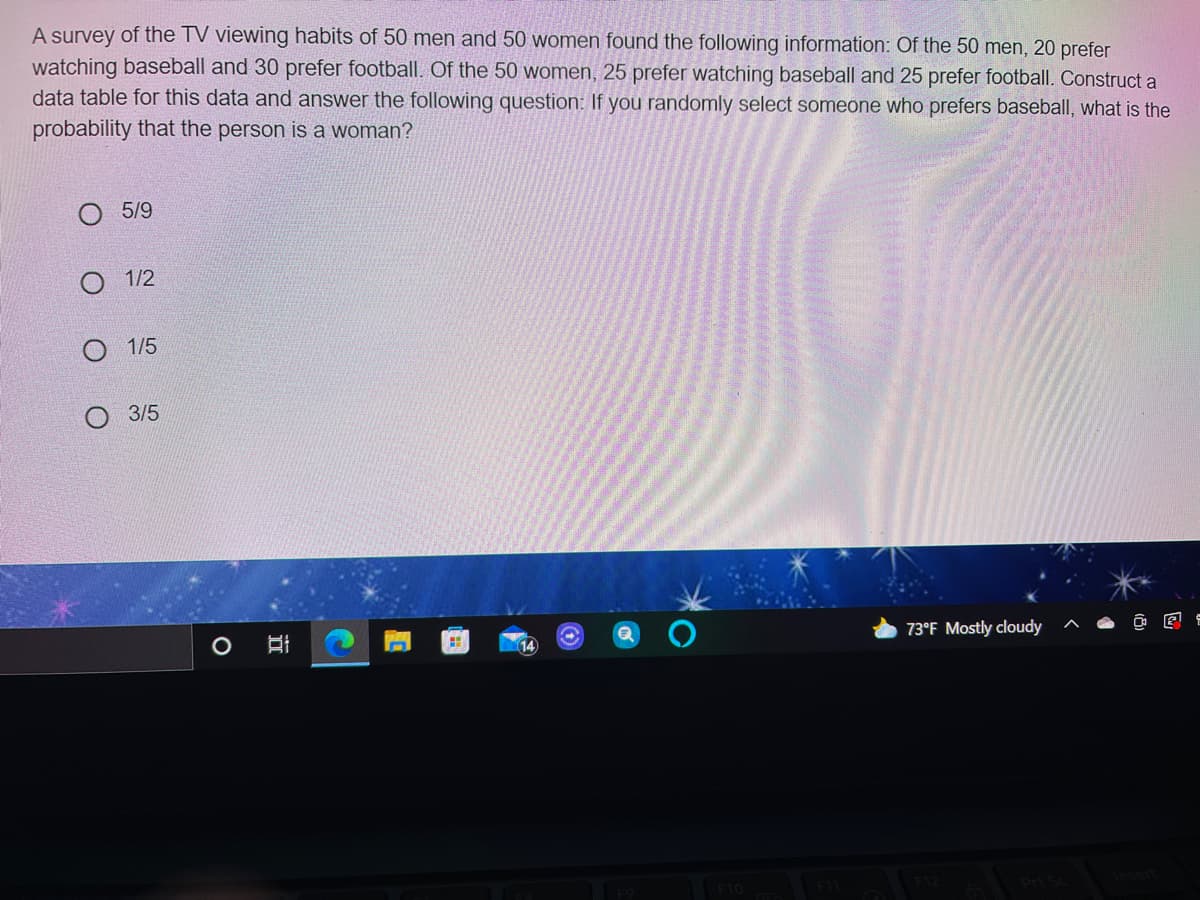
A survey of the TV viewing habits of 50 men and 50 women found the following information: Of the 50 men, 20 prefer watching baseball and 30 prefer football. Of the 50 women, 25 prefer watching baseball and 25 prefer football. Construct a data table for this data and answer the following question: If you randomly select someone who prefers baseball, what is the probability that the person is a woman? 5/9 О 12 О 15 3/5


Q: A survey of TV viewing habits of 50 men and 50 women found the following information: Of the 50 men,…
A: Here total men are 50, and total women are 50. So, total number of people are 100.
Q: In a sample of 150 residents, each person was asked if he or she favored the concept of having a…
A: (a) Obtain the probability that the person will favor the concept given that the person selected is…
Q: In recent study of nurses of a local hospital, eight hundred and twenty four said that they prefer…
A:
Q: A survey of 240 10th grade students at a local high school found that there were 140 girls and 100…
A: Given that Total number of students=240 Number of boys=100 Number of girls=140
Q: A survey of the TV viewing habits of 50 men and 50 women found the following information: Of the 50…
A: Given that Total number of people=100 Number of men=50 Number of women=50
Q: he following data represent the number of traffic fatalities in Country A in 2015 by person type…
A: Given data, Person type Male Female Total Driver 20,780 6,595 27375…
Q: a. If one person is selected at random from this study, what is the probability they purchased a…
A: This is a very useful medium of presenting a data . Many calculations can be carried on easily .
Q: A survey of TV viewing habits of 50 men and 50 women found the following information: Of the 50 men,…
A:
Q: Given the following two-way classification table for a survey of data regarding the number of…
A:
Q: Consider the following data on sports fan revealing their preferred sport and preferred beverage.…
A: Given that Sport\Beverages Beer Wine Liquor Total Basketball 17% 6% 9% 32% Football 30%…
Q: A research study uses 800 men under the age of 60. Suppose that 40% carry a marker on the male…
A: From the given data P=40%=0.40
Q: In a previous year, the weights (in pounds) of the members of the San Francisco 49ers and the Dallas…
A: Given, Shirt <210 211 - 250 251 - 290 >290 Total 1 - 33 21 5 0 0 26 34 - 66 6 18 7 4 35…
Q: At a soup kitchen, a social worker gathers the following data. Of those visiting the kitchen, 59…
A: Hello! As you have posted 2 different questions, we are answering the first question. In case you…
Q: Medical researchers followed 6272 Swedish men for 30 years to see if there was any association…
A: Given Data : Fish Consumption No Prostate Cancers Prostate Cancers Never/Seldom 110 14 Small…
Q: In an experiment to study the relationship of hypertension and smoking habits, the following data…
A: Given, Non Smoker Moderate Smokers Heavy Smokers Total Hypertension (H) 65 54 81 200 No…
Q: he table shows the responses of 125 people to the question of whether they prefer Coffee or Tea or…
A: General formula of probability is , Probability =Number of favorable outcomes Total outcomes…
Q: In an experiment to study the relationship of hypertension and smoking habits, the following data…
A:
Q: Table 3.6 shows a random sample of 200 cyclists and the routes they prefer. Let M = males and H =…
A:
Q: subjects who have received and not received a speeding ticket in the last year, and the color of…
A: From the available information , the table is, Red car Not red car Total Speeding ticket 45…
Q: A survey of 240 10th grade students at a local high school found that there were 140 girls and 100…
A:
Q: The following data contains regarding the preference in type of vehicle and gender.…
A: Solution: Let us write the table with row and column totals. Sedan Coupe SUV Pickup Minivan…
Q: A survey of TV viewing habits of 50 men and 50 women found the following information: Of the 50 men,…
A: The number of men is 50 and the number of women is 50.
Q: A survey of students was conducted to study the relationship between the types of housing a student…
A: Last Option is correct 54.81%
Q: A survey of TV viewing habits of 50 men and 50 women found the following information: Of the 50 men,…
A: The number of men is 50 and the number of women is 50.
Q: A survey of students was conducted to study the relationship between the types of housing a student…
A: Given: The table below contain data
Q: For a week, a clothing company tracks the amounts spent by its customers, with the results shown to…
A:
Q: In an experiment to study the relationship of hypertension and smoking habits, the following data…
A:
Q: A survey of the TV viewing habits of 50 men and 50 women found the following information: Of the 50…
A: Introduction: It is required to find the probability that a randomly selected person is a woman, if…
Q: A survey of the TV viewing habits of 50 men and 50 women found the following information: Of the 50…
A: Given query is to find the probability of random selected woman to be the one like watching…
Q: The following data contains regarding the preference in type of vehicle and gender.…
A: we are suppose to answer three sub parts .
Q: In an experiment to study the relationship of hypertension and smoking habits, the following data…
A:
Q: A survey of the TV viewing habits of 50 men and 50 women found the following information: Of the 50…
A:
Q: A random sample of college students were asked to respond to a survey about how they spend their…
A: Obtain the probability that the student is female. The probability that the student is female is…
Q: A survey of the TV viewing habits of 50 men and 50 women found the following information: Of the 50…
A:
Q: Answer for d
A: d) Total number of persons observed is = (905+480+650+2330)= 4365 Total person having head injury =…
Q: According to an article in the February 1991 issue of Reader’s Digest, patients face a 1 in 20…
A: From the provided information, Patients face 1 in 20 chance of acquiring an infection while…
Q: A pollster asked 1000 adults whether Republicans or Democrats have better domestic economic…
A: Obtain the probability that a randomly selected adult is a female or think that Democrats have…
Q: • A random sample of 200 adults are classified be- low by sex and their level of education attained.…
A: Solution: The given table of data is
Q: The manager of a used car lot took inventory of the automobiles on his lot and constructed the…
A: Given information: Total number of cars in lot = 200 Number of foreign cars = 100 Number of foreign…
Q: The gender, and programmes of some MEC students collected from a random sampling are given below:…
A: Given the gender and programmes of MCE students as Civil Engineering Electronics and…
Q: The table below shows the soft drinks preferences of people in three age groups. COLA ROOT BEER…
A: Solution
Q: A random sample of 200 adults are classified below according to gender and the level of education…
A: The sample size n is 200.
Q: Answer for d
A: (d) Total number of the subjects who suffered head injuries = 905 + 480 Total number of the subjects…
Q: The table below describes the smoking habits of a group of asthma sufferers. Light Heavy Nonsmoker…
A: Part a: The probability that the person chosen is heavy smoker given that the person is a man is…
Q: There are declining levels of cooperation among persons contacted in surveys and this brings…
A: Total = 368 people Number of people in 22-29 age bracket = 276 Number of people who agree to respond…
Q: A) If a patient is randomly selected, what is the probability that he/she had prostate cancer given…
A: Given Fish Consumption No Prostate Cancer Prostate Cancer Total Never/Seldom 110 14 124 Small…
Q: A survey of 240 10th grade students at a local high school found that there were 140 girls and 100…
A:
Q: A random sample of 200 adults are classified below by gender and their level of education attained.…
A: Given data: Random sample = 200 To find:
Q: A survey of 240 10th grade students at a local high school found that there were 140 girls and 100…
A:
Q: Consider the following table with information about a sample of students from Discovery High School…
A: total number of students=120 total number of students using car=26 total number of students using…


Trending now
This is a popular solution!

Step by step
Solved in 2 steps with 1 images

- An insurance investigator has observed that people with some astrological signs tend to be safer drivers than people with other signs. Using insurance records, the investigator classified 150 people according to their astrological signs and whether or not they were involved in a car accident during the previous 12 months. Do the following data indicate a significant relationship between sign and accidents? Test with a = .05. Libra Leo Gemini Accident 7 4 19 No Accident 73 46 1Suppose that a researcher is interested in the average standardized test score for fifth graders in a local school district. The fifth graders at a specific school would comprise a ___________ and their average test score would be a ___________.Researchers wanted to determine whether fence lizards learned to avoid fire ants. To determine this, they gathered lizards from eastern Arkansas (where there were no fire ants), and from southern Alabama (which had been invaded by fire ants). The lizards were then exposed to fire ants, and researchers measured how long (in seconds) it took the lizards to flee. What does each dot represent? Choose the best answer. Choice 1:A difference in time to flee for a single lizard from Alabama, and a single lizard from Arkansas, assuming the null hypothesis is true. Choice 2:A difference in mean response times for one sample of lizards from Alabama, and one sample of lizards from Arkansas, which was likely to occur if the null hypothesis is true. Choice 3:A difference in response times for two lizards in our sample. Choice 4:The proportion of all lizards who will free from fire ants. Which Choice is most correct and why?
- Strack, martin and Stepper (1988) reported that people rate cartoons as funnier when holding a pen in their teeth (Which force them to frown.) a researcher attempted to replicate this result using a sample of n = 30 adults between the ages of 32-37. For each person, the researcher recorded the difference between the rating obtained while smiling and the rating obtained while frowning. On the average cartoons were rated as funnier when the participants were smiling, with an average difference of 2.6 with SS = 200. a) Do the data indicate that the cartoons are rated significantly funnier when the participants are smiling? Use a two tailed test with α = 0.05. (Use the four logical steps in hypothesis testing) b) Compute for r2 to measure the size of the treatment effect. c) Write a sentence describing the outcome of the hypothesis test and the measure of effect size as it would appear in a research paper.Item 9 At a research facility that designs rocket engines, researchers know that some engines fail to ignite as a result of fuel system error. From a random sample of 40 engines of one design, 14 failed to ignite as a result of fuel system error. From a random sample of 30 engines of a second design, 9 failed to ignite as a result of fuel system error. The researchers want to estimate the difference in the proportion of engine failures for the two designs. Which of the following is the most appropriate method to create the estimate? A one-sample z-interval for a sample proportion A A one-sample z-interval for a population proportion B A two-sample z-interval for a population proportion C A two-sample z-interval for a difference in sample proportions D A two-sample z-interval for a difference in population proportionsA psychologist examining art appreciation selected an abstract painting that had no obvious top or bottom. Hangers were placed on the painting so that it could be hung with any one of the four sides at the top. The painting was shown to a sample of n = 50 participants, and each was asked to hang the painting in the orientation that looked correct. The following data indicate how many people chose each of the four sides to be placed at the top. Are any of the orientations selected more (or less) often than would be expected simply by chance? Test with a = .05. Top Up (correct) Bottom up Left side up Right side up 18 17 7 8
- Suppose IQ scores were obtained for 20 randomly selected sets of siblings. The 20 pairs of measurements yield x=104.18, y=105.25, r=0.892, P-value=0.000, and y=17.77+0.84x, where x represents the IQ score of the younger child. Find the best-predicted value of y given that the younger childhas an IQ of 108? The best-predicted value of y is?Produce a CROSSTAB for the variables DEGREE and MARHOMO. Before conducting the analyses, reverse code MARHOMO into R_MARHOMO so that 1 = Strongly Disagree; 2 = Disagree; 3 = Neither Agree nor Disagree; 4 = Agree; and 5 = Strongly Agree. Then, examine the relationship between these variables by testing both statistical significance and strength of association. Use chi-square for significance and choose the appropriate measures for strength of association (Phi, Cramer’s V, Lambda, or Gamma). Set alpha to .05. State the null and research hypotheses: H0: H1: What is the obtained chi-square value? What is the significance level (p-value) for the obtained chi-square? Should we reject or fail to reject the null hypothesis? Is there a statistically significant relationship between these variables? Which measure of association would be most appropriate for these variables? What is the value of the measure of association? Interpret your findings by explaining in full sentences whether there is a…Consider the next 1,000 95% CIs for \mu that a statistical consultant will obtain for various clients. Suppose the data sets on which the intervals are based are selected independently of one another. What is the probability that between 940 and 960 of these intervals contain the corresponding value of \mu?
- If the p value from the output of SPSS is .02, thenI'm having issue with E because I don't know the p-valueIf the data is weight, the z-score for someone who is overweight would be what?? if the data is time spent watching TV, an individual with a z-score of zero would do what?? if the data is an annual salary in the US, and the population is all legally employed people in the US, the z-Score of people who make minimum wage would be what??