The table below describes the smoking habits of a group of asthma sufferers. Light Heavy Nonsmoker smoker smoker Total Men 346 70 88 504 Women 362 63 85 510 Total 708 133 173 1014 a. If one of the 1014 subjects is randomly selected, find the probability that the person chosen is heavy smoker given that the person is a man. Round to the nearest thousandth. b. If one of the 1014 subjects is randomly selected, find the probability that the person chosen is heavy smoker or a man. Round to the nearest thousandth. c. If two of the 1014 subjects are randomly selected, find the probability that the first person chosen is heavy smoker and the second person is a nonsmoker. Round to the nearest thousandth.
The table below describes the smoking habits of a group of asthma sufferers. Light Heavy Nonsmoker smoker smoker Total Men 346 70 88 504 Women 362 63 85 510 Total 708 133 173 1014 a. If one of the 1014 subjects is randomly selected, find the probability that the person chosen is heavy smoker given that the person is a man. Round to the nearest thousandth. b. If one of the 1014 subjects is randomly selected, find the probability that the person chosen is heavy smoker or a man. Round to the nearest thousandth. c. If two of the 1014 subjects are randomly selected, find the probability that the first person chosen is heavy smoker and the second person is a nonsmoker. Round to the nearest thousandth.

Holt Mcdougal Larson Pre-algebra: Student Edition 2012
1st Edition
ISBN:9780547587776
Author:HOLT MCDOUGAL
Publisher:HOLT MCDOUGAL
Chapter11: Data Analysis And Probability
Section11.8: Probabilities Of Disjoint And Overlapping Events
Problem 2C

Related questions

Concept explainers
Contingency Table
A contingency table can be defined as the visual representation of the relationship between two or more categorical variables that can be evaluated and registered. It is a categorical version of the scatterplot, which is used to investigate the linear relationship between two variables. A contingency table is indeed a type of frequency distribution table that displays two variables at the same time.
Binomial Distribution
Binomial is an algebraic expression of the sum or the difference of two terms. Before knowing about binomial distribution, we must know about the binomial theorem.
Topic Video
Question
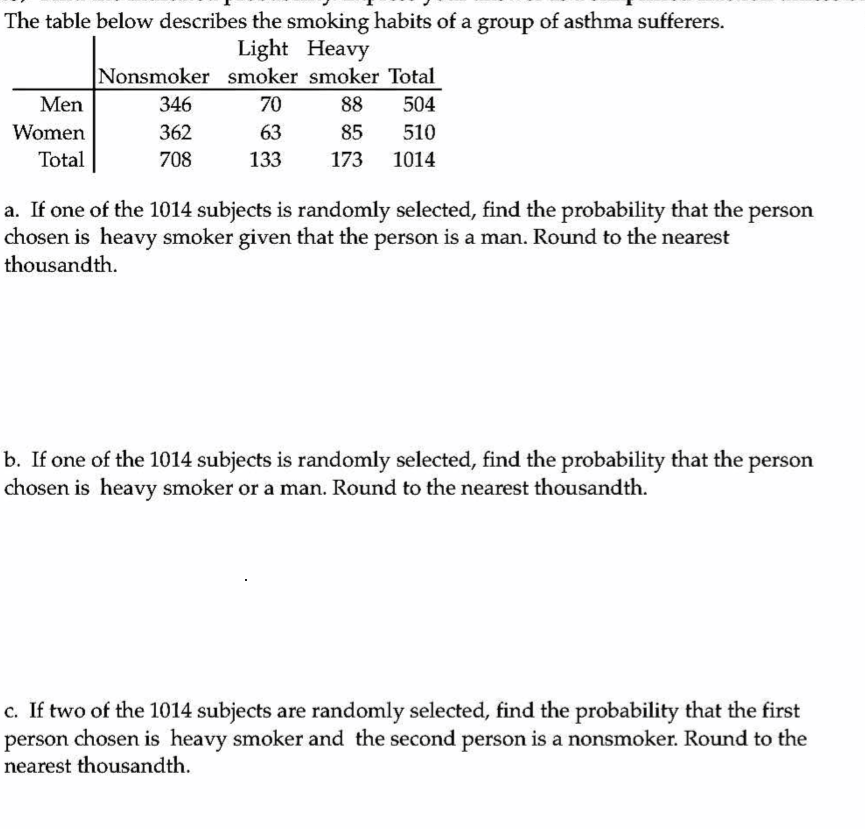
Transcribed Image Text:The table below describes the smoking habits of a group of asthma sufferers.
Light Heavy
Nonsmoker smoker smoker Total
Men
346
70
88
504
Women
362
63
85
510
Total
708
133
173
1014
a. If one of the 1014 subjects is randomly selected, find the probability that the person
chosen is heavy smoker given that the person is a man. Round to the nearest
thousandth.
b. If one of the 1014 subjects is randomly selected, find the probability that thej
chosen is heavy smoker or a man. Round to the nearest thousandth.
person
c. If two of the 1014 subjects are randomly selected, find the probability that the first
person chosen is heavy smoker and the second person is a nonsmoker. Round to the
nearest thousandth.
Expert Solution
This question has been solved!
Explore an expertly crafted, step-by-step solution for a thorough understanding of key concepts.

This is a popular solution!

Trending now
This is a popular solution!

Step by step
Solved in 3 steps

Knowledge Booster


Learn more about
Need a deep-dive on the concept behind this application? Look no further. Learn more about this topic, statistics and related others by exploring similar questions and additional content below.Recommended textbooks for you
Holt Mcdougal Larson Pre-algebra: Student Edition…
Algebra
ISBN:
9780547587776
Author:
HOLT MCDOUGAL
Publisher:
HOLT MCDOUGAL

Holt Mcdougal Larson Pre-algebra: Student Edition…
Algebra
ISBN:
9780547587776
Author:
HOLT MCDOUGAL
Publisher:
HOLT MCDOUGAL