A tennis shop sells five different brands of rackets, each of which comes in either a midsize version or an oversize version. Consider the chance experiment in which brand and size are noted for the next racket purchased. One possible outcome is Head midsize, and another is Prince oversize. Possible outcomes correspond to cells in the following table: Head Prince Slazenger
A tennis shop sells five different brands of rackets, each of which comes in either a midsize version or an oversize version. Consider the chance experiment in which brand and size are noted for the next racket purchased. One possible outcome is Head midsize, and another is Prince oversize. Possible outcomes correspond to cells in the following table: Head Prince Slazenger

Holt Mcdougal Larson Pre-algebra: Student Edition 2012
1st Edition
ISBN:9780547587776
Author:HOLT MCDOUGAL
Publisher:HOLT MCDOUGAL
Chapter11: Data Analysis And Probability
Section: Chapter Questions
Problem 8CR

Related questions
Question
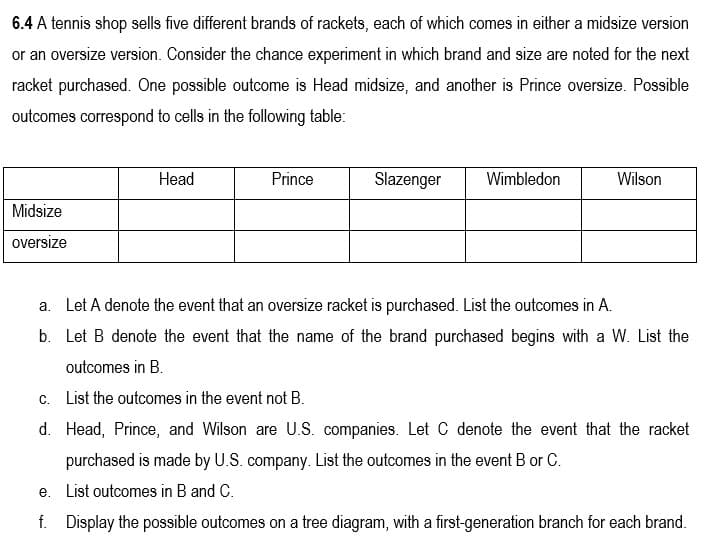
A tennis shop sells five different brands of rackets, each of which comes in either a midsize version or an oversize version. Consider the chance experiment in which brand and size are noted for the next racket purchased. One possible outcome is Head midsize, and another is Prince oversize. Possible outcomes correspond to cells in the following table:
|
|
Head |
Prince |
Slazenger |
Wimbledon |
Wilson |
|
Midsize |
|
|
|
|
|
|
oversize |
|
|
|
|
|
- Let A denote the
event that an oversize racket is purchased. List the outcomes in A. - Let B denote the event that the name of the brand purchased begins with a W. List the outcomes in B.
- List the outcomes in the event not B.
- Head, Prince, and Wilson are U.S. companies. Let C denote the event that the racket purchased is made by U.S. company. List the outcomes in the event B or C.
- List outcomes in B and C.
- Display the possible outcomes on a tree diagram, with a first-generation branch for each brand.
Transcribed Image Text:6.4 A tennis shop sells five different brands of rackets, each of which comes in either a midsize version
or an oversize version. Consider the chance experiment in which brand and size are noted for the next
racket purchased. One possible outcome is Head midsize, and another is Prince oversize. Possible
outcomes correspond to cells in the following table:
Head
Prince
Slazenger
Wimbledon
Wilson
Midsize
oversize
a. Let A denote the event that an oversize racket is purchased. List the outcomes in A.
b. Let B denote the event that the name of the brand purchased begins with a W. List the
outcomes in B.
c. List the outcomes in the event not B.
d. Head, Prince, and Wilson are U.S. companies. Let C denote the event that the racket
purchased is made by U.S. company. List the outcomes in the event B or C.
e. List outcomes in B and C.
f. Display the possible outcomes on a tree diagram, with a first-generation branch for each brand.
Expert Solution
This question has been solved!
Explore an expertly crafted, step-by-step solution for a thorough understanding of key concepts.

This is a popular solution!

Trending now
This is a popular solution!

Step by step
Solved in 2 steps with 2 images

Recommended textbooks for you
Holt Mcdougal Larson Pre-algebra: Student Edition…
Algebra
ISBN:
9780547587776
Author:
HOLT MCDOUGAL
Publisher:
HOLT MCDOUGAL
Holt Mcdougal Larson Pre-algebra: Student Edition…
Algebra
ISBN:
9780547587776
Author:
HOLT MCDOUGAL
Publisher:
HOLT MCDOUGAL