A random sample of n1 = 10 regions in New England gave the following violent crime rates (per million population). x1: New England Crime Rate 3.3 3.7 4.2 3.9 3.3 4.1 1.8 4.8 2.9 3.1 Another random sample of n2 = 12 regions in the Rocky Mountain states gave the following violent crime rates (per million population). x2: Rocky Mountain Crime Rate 3.5 4.1 4.7 5.5 3.3 4.8 3.5 2.4 3.1 3.5 5.2 2.8 Assume that the crime rate distribution is approximately normal in both regions. Do the data indicate that the violent crime rate in the Rocky Mountain region is higher than in New England? Use ? = 0.01. Solve the problem using both the traditional method and the P-value method. (Test the difference ?1 − ?2. Round the test statistic and critical value to three decimal places.) test statistic critical value Find (or estimate) the P-value. A. P-value > 0.250 B. 0.125 < P-value < 0.250 C. 0.050 < P-value < 0.125 D. 0.025 < P-value < 0.050 E. 0.005 < P-value < 0.025 F. P-value < 0.005 Conclusion A. Reject the null hypothesis, there is insufficient evidence that violent crime in the Rocky Mountain region is higher than in New England. B. Reject the null hypothesis, there is sufficient evidence that violent crime in the Rocky Mountain region is higher than in New England. C. Fail to reject the null hypothesis, there is insufficient evidence that violent crime in the Rocky Mountain region is higher than in New England. D. Fail to reject the null hypothesis, there is sufficient evidence that violent crime in the Rocky Mountain region is higher than in New England. Compare your conclusion with the conclusion obtained by using the P-value method. Are they the same? A. We reject the null hypothesis using the traditional method, but fail to reject using the P-value method. B. The conclusions obtained by using both methods are the same. C. These two methods differ slightly. D. We reject the null hypothesis using the P-value method, but fail to reject using the traditional method.


A random sample of n1 = 10 regions in New England gave the following violent crime rates (per million population).
| 3.3 | 3.7 | 4.2 | 3.9 | 3.3 | 4.1 | 1.8 | 4.8 | 2.9 | 3.1 |
Another random sample of n2 = 12 regions in the Rocky Mountain states gave the following violent crime rates (per million population).
| 3.5 | 4.1 | 4.7 | 5.5 | 3.3 | 4.8 | 3.5 | 2.4 | 3.1 | 3.5 | 5.2 | 2.8 |
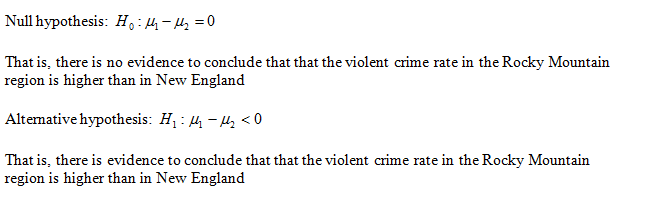
Assume that the crime rate distribution is approximately normal in both regions. Do the data indicate that the violent crime rate in the Rocky Mountain region is higher than in New England? Use ? = 0.01. Solve the problem using both the traditional method and the P-value method. (Test the difference ?1 − ?2. Round the test statistic and critical value to three decimal places.)
| test statistic | |
| critical value |
Find (or estimate) the P-value.
Conclusion
Compare your conclusion with the conclusion obtained by using the P-value method. Are they the same?
State the hypotheses.
Determine the value of the test statistic.
Use EXCEL to obtain the value of test statistic.
EXCEL procedure:
- Go to EXCEL
- Go to Data>Data Analysis.
- Choose t-test: Two Sample assuming equal variances.
- Enter the range for variable 1 as $A$1:$A$11.
- Enter the range for variable 2 as $B$1:$B$13
- Enter the hypothesis mean difference as 0
- Check the option Labels in First row.
- Enter the alpha level as 0.01.
- Click OK.
EXCEL output:
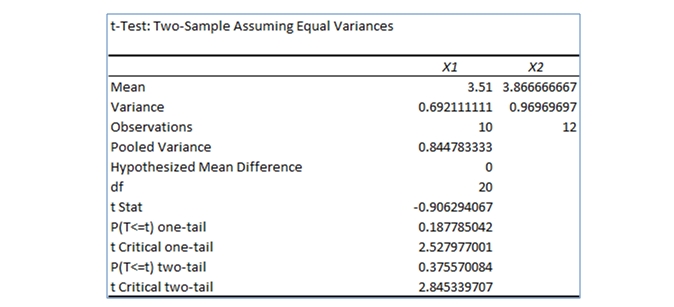
From the EXCEL output the value of test statistic is –0.906.
Thus, the value of the test statistic is –0.906.
Determine the critical value.
From the EXCEL output, the critical value is –2.528.
Thus, the critical value is –2.528
Obtain the P-value.
From the EXCEL output, the P-value is 0.1878
Thus, the P-value lies between the range 0.125 < P-value < 0.250.
Correct option: Option B
The conclusion is obtained as shown below:
Use the level of significance is 0.01
That is, the value of test statistic is –0.906 and the critical value is –2.528

By rejection rule, do not reject the null hypothesis.
Fail to reject the null hypothesis, there is insufficient evidence that violent crime in the Rocky Mountain region is higher than in New England.
Correct option: Option C

Step by step
Solved in 3 steps with 4 images


