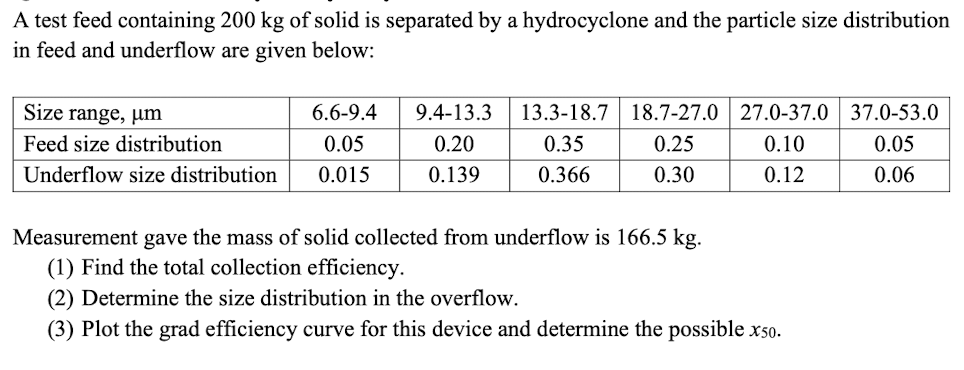
A test feed containing 200 kg of solid is separated by a hydrocyclone and the particle size distribution in feed and underflow are given below: Size range, um Feed size distribution Underflow size distribution 6.6-9.4 0.05 0.015 9.4-13.3 0.20 0.139 13.3-18.7 18.7-27.0 27.0-37.0 0.25 0.35 0.10 0.366 0.30 0.12 Measurement gave the mass of solid collected from underflow is 166.5 kg. (1) Find the total collection efficiency. (2) Determine the size distribution in the overflow. (3) Plot the grad efficiency curve for this device and determine the possible x50. 37.0-53.0 0.05 0.06
A test feed containing 200 kg of solid is separated by a hydrocyclone and the particle size distribution in feed and underflow are given below: Size range, um Feed size distribution Underflow size distribution 6.6-9.4 0.05 0.015 9.4-13.3 0.20 0.139 13.3-18.7 18.7-27.0 27.0-37.0 0.25 0.35 0.10 0.366 0.30 0.12 Measurement gave the mass of solid collected from underflow is 166.5 kg. (1) Find the total collection efficiency. (2) Determine the size distribution in the overflow. (3) Plot the grad efficiency curve for this device and determine the possible x50. 37.0-53.0 0.05 0.06

Introduction to Chemical Engineering Thermodynamics
8th Edition
ISBN:9781259696527
Author:J.M. Smith Termodinamica en ingenieria quimica, Hendrick C Van Ness, Michael Abbott, Mark Swihart
Publisher:J.M. Smith Termodinamica en ingenieria quimica, Hendrick C Van Ness, Michael Abbott, Mark Swihart
Chapter1: Introduction
Section: Chapter Questions
Problem 1.1P

Related questions
Question
Transcribed Image Text:A test feed containing 200 kg of solid is separated by a hydrocyclone and the particle size distribution
in feed and underflow are given below:
Size range, um
Feed size distribution
Underflow size distribution
6.6-9.4
0.05
0.015
9.4-13.3
0.20
0.139
13.3-18.7 18.7-27.0 27.0-37.0
0.25
0.35
0.10
0.366
0.30
0.12
Measurement gave the mass of solid collected from underflow is 166.5 kg.
(1) Find the total collection efficiency.
(2) Determine the size distribution in the overflow.
(3) Plot the grad efficiency curve for this device and determine the possible x50.
37.0-53.0
0.05
0.06
Expert Solution
This question has been solved!
Explore an expertly crafted, step-by-step solution for a thorough understanding of key concepts.

Step by step
Solved in 5 steps with 5 images

Recommended textbooks for you
Introduction to Chemical Engineering Thermodynami…
Chemical Engineering
ISBN:
9781259696527
Author:
J.M. Smith Termodinamica en ingenieria quimica, Hendrick C Van Ness, Michael Abbott, Mark Swihart
Publisher:
McGraw-Hill Education

Elementary Principles of Chemical Processes, Bind…
Chemical Engineering
ISBN:
9781118431221
Author:
Richard M. Felder, Ronald W. Rousseau, Lisa G. Bullard
Publisher:
WILEY

Elements of Chemical Reaction Engineering (5th Ed…
Chemical Engineering
ISBN:
9780133887518
Author:
H. Scott Fogler
Publisher:
Prentice Hall
Introduction to Chemical Engineering Thermodynami…
Chemical Engineering
ISBN:
9781259696527
Author:
J.M. Smith Termodinamica en ingenieria quimica, Hendrick C Van Ness, Michael Abbott, Mark Swihart
Publisher:
McGraw-Hill Education
Elementary Principles of Chemical Processes, Bind…
Chemical Engineering
ISBN:
9781118431221
Author:
Richard M. Felder, Ronald W. Rousseau, Lisa G. Bullard
Publisher:
WILEY
Elements of Chemical Reaction Engineering (5th Ed…
Chemical Engineering
ISBN:
9780133887518
Author:
H. Scott Fogler
Publisher:
Prentice Hall


Industrial Plastics: Theory and Applications
Chemical Engineering
ISBN:
9781285061238
Author:
Lokensgard, Erik
Publisher:
Delmar Cengage Learning

Unit Operations of Chemical Engineering
Chemical Engineering
ISBN:
9780072848236
Author:
Warren McCabe, Julian C. Smith, Peter Harriott
Publisher:
McGraw-Hill Companies, The