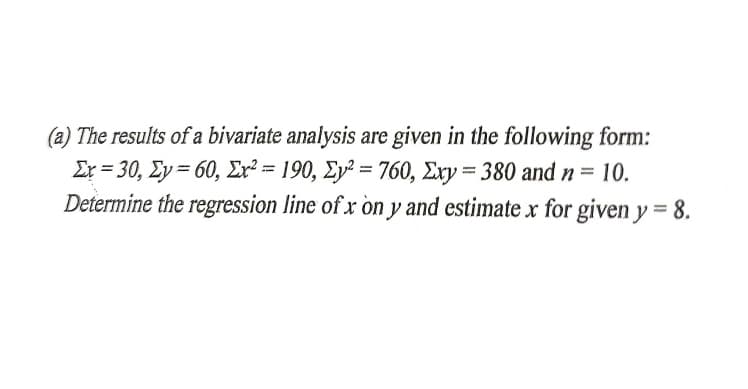
(a) The results of a bivariate analysis are given in the following form: Ex = 30, Ey = 60, Er² = 190, Ey² = 760, Exy = 380 and n = 10. Determine the regression line of x òn y and estimate x for given y = 8.


Q: The monthly starting salaries of students who receive an MBA degree have a population standard devia...
A:
Q: True or False and justify why. 1.The median of Figure (a) is greater than that of Figure (b). 2. ...
A: Given 2 histograms.
Q: a. How many degrees of freedom are there in determining the among-group variation? b. How many degre...
A: here given there are 8 group with four values in each c= 8 so here n = 8 * 4 = 32
Q: A sample of 100 dry battery cells tested to find the length of life produced the lollowing results :...
A:
Q: E xercises A. Suppose that the z is the test statistic for hypothesis testing, calculate the valu z ...
A:
Q: We wish to estimate the mean price of gasoline (per gallon) at gas stations across Saskatchewan, ass...
A: Given information- Population standard deviation, σ = 16.7 cents Confidence interval = 0.99 Signific...
Q: TRUE / FALSE) If θ^MM is the MM estimator of θ, f(θ^MM ) is the MM estimator of f(θ) where f is a co...
A: Solution
Q: Compute the least-squares regression equation for the given data set. Use a TI-84 calculator. Round ...
A:
Q: In testing an HP printer, the Quality Inspector found that 25% of the printers fail to pass the test...
A: Obtain the probability that fewer than 4 fail to pass the test print. The probability that fewer tha...
Q: A not A total В 0.55 not B 0.55 0.34 total 1
A:
Q: in Output 1. Based on Output 1, at a significance level of 1%, Output 1 ANOVA Source of Variation SS...
A: We have given that the significance level 1% i.e, 0.01. The p-value is given that 0.001474.
Q: Wé wish tó éstimaté the mean price of gasoline (per gallon) at gas stations across Saskatchewan, ass...
A:
Q: (Confidence interval for mean predicted value) For the data given estimate the mean weight of a cub ...
A:
Q: When is the unexplained variation (that is, error sum of squares) equal to 0? Choose the correct cho...
A: The error sum of squares is equal to zero when,
Q: What would be the expected value, variance and standard deviation of an event that always took the v...
A:
Q: Several anthropology students are unprepared for a surprise true/false test with 17 questions, and a...
A: Given : probability of success, p=0.5 sample size,n=17
Q: Let X denote the amount of space occupied by an article placed in a 1-ft packing container. The pdf ...
A: "Since you have posted a question with multiple subparts, we will solve first 3 sub-parts for you. T...
Q: There are 4 buses running between two cities. In how many ways can a man go from one city to other a...
A:
Q: Use the data in the following table, which lists drive-thru order accuracy at popular fast food chai...
A:
Q: Two trains arrive at a station at random between 7 A.M. and 7:30 A.M. One train stops for 5 min and ...
A:
Q: Show that for a random sample of size 100, drawn with replacement, the stand- ard error of sample pr...
A:
Q: I have gotten the wrong answers on this question if you could kindly help out with the correct answe...
A: Note: According to Bartleby guidelines expert, solve only one question and maximum 3 subpart of the ...
Q: Consider the following Stock-Recruitment Curve and then tell us the ideal way to manage this populat...
A: Given Consider the following Stock-Recruitment Curve and then tell us the ideal way to manage this p...
Q: Find the mean
A: Here given, p = 0.2 n= 8
Q: Using the TI-84 calculator, find the area under the standard normal curve that lies outside the inte...
A:
Q: Assume the random variable Xhas a binomial distribution with the given probability of obtaining a su...
A: given,X~binomial(n,p)where no of trials(n)=5 and probability of success(p)=0.6find , P(X≤1)=?we k...
Q: (b) Compute the correlation coefficient between the price of eggs and the price of milk. Round the a...
A: Define the variable dozen eggs as x and the variable gallon of milk as y.
Q: Example 3-64. A bag contains 17 counters marked with the numbers 1 to 17. A counter is drawn and rep...
A:
Q: We wish to test if a new feed increases the mean weight gain compared to an old feed. At the conclus...
A: Let μ1:new feedμ2:old feed The hypothesis test is H0:μ1-μ2=18H1:μ1-μ2>18 The p-value=0.0...
Q: What would be your point estimate? interval estimate?
A: A research company published the results of its latest national poll. In this poll, 31.6% people cho...
Q: Price of eggs and milk: The following table presents the average price in dollars for a dozen eggs a...
A: Obtain the value of the correlation coefficient. Use EXCEL to obtain the value correlation coeffic...
Q: Calculate mean deviation from mean and median for the following data: 100, 150, 200, 250, 360, 490, ...
A: Solution is given:
Q: Compute for the appropriate sample size if the margin of error is 6, with a sample standard deviatio...
A:
Q: Find the probability that a student participates in less than three activities
A: Here given probability distribution of x X = no of activities students take part
Q: 7. You read a study in which the result is significant (p 6 .05). You then look at the size of the s...
A: Given that - You read a study in which the result is significant (p < .05). You then lookat the s...
Q: The mean volume of a large population of vials used to be 10.9 ml. To test whether this value has de...
A:
Q: You wish to test the following claim (H.) at a significance level of a = 0.02. H.:µ = 78.8 Ha:u # 78...
A:
Q: True or False: All possible standardized Pearson rs, if plotted on a Cartesian plane, exist between ...
A: Correlation means the study of interrelation between two variables which measures the strength of or...
Q: A sample of university students has an average GPA of 2.78 with a standard deviation of 0.45. If GPA...
A: as per bartleby guideline expert have to answer first three subpart only dear student please upload ...
Q: The mean length of steel bolts from a manufacturing process is advertised as 15.1 mm. An inspector b...
A: Given,sample size(n)=280sample mean(x¯)=15.6population standard deviation(σ)=5α=0.1
Q: 36. A political scientist wanted to know about the political preferences of people in a large Canadi...
A: Here Population is people in large Canadian City. Sample is 500 individual sampled using list of al...
Q: 2x* + 4) dx -5 6x
A:
Q: In a hurdle race, a player has to cross 6 hurdles. The probability that he will clear each hurdle is...
A: Let p denote the probability of clearing the hurdle. Given that p = 5/6 Total number of hurdles = 6
Q: normal pdf.
A: For a normal distribution with parameters μ &σ the pdf is given by:
Q: Determine the mean of all sample modes. Based on your result, is the sample mode an unbiased estima...
A: Mean of all sample modes, Modes: 0,0,10, 0,0,0,0,10, 10, 10 Mean of modes= (10+10+10+10)/10 = 4
Q: You work for the U.S. Food and Drug Administration. You have gotten word that a drug manufacturing i...
A:
Q: When each member of one sample corresponds to a member of the other sample, these two samples are co...
A: Given that When each member of one sample corresponds to a member of the other sample, these two sa...
Q: What do you think about W.S Gosset's contribution to inferrential statistics?
A:
Q: Use the data shown above to construct a 96% confidence interval estimate for the mean amount of cold...
A: Here given 20 sample data Calculate sample statistics and then interval Here use t distribution Tabl...
Q: Compute the least-squares regression line for predicting the 2012 budget from the 2006 budget.
A: Here Y = budget in 2012 (in millions of dollars) X = budget in 2006 (in millions of dollars)

Step by step
Solved in 2 steps with 2 images

- The following fictitious table shows kryptonite price, in dollar per gram, t years after 2006. t= Years since 2006 0 1 2 3 4 5 6 7 8 9 10 K= Price 56 51 50 55 58 52 45 43 44 48 51 Make a quartic model of these data. Round the regression parameters to two decimal places.Olympic Pole Vault The graph in Figure 7 indicates that in recent years the winning Olympic men’s pole vault height has fallen below the value predicted by the regression line in Example 2. This might have occurred because when the pole vault was a new event there was much room for improvement in vaulters’ performances, whereas now even the best training can produce only incremental advances. Let’s see whether concentrating on more recent results gives a better predictor of future records. (a) Use the data in Table 2 (page 176) to complete the table of winning pole vault heights shown in the margin. (Note that we are using x=0 to correspond to the year 1972, where this restricted data set begins.) (b) Find the regression line for the data in part ‚(a). (c) Plot the data and the regression line on the same axes. Does the regression line seem to provide a good model for the data? (d) What does the regression line predict as the winning pole vault height for the 2012 Olympics? Compare this predicted value to the actual 2012 winning height of 5.97 m, as described on page 177. Has this new regression line provided a better prediction than the line in Example 2?A sample of the number of sales per hour at Store X and the number of sales at Store Y at the same times is as indicated below. Find the Y-value of the regression line where X = 5. X Y 0 1 0 2 1 2 3 4 4 6
- The grades of a sample of 9 students on a prelim exam (x) and on the midterm exam (y) are shown below. Find the regression equation. y = 34.661 + 0.433x y = 0.777 + 12.0623x y = 12.0623 + 0.777x y = 34.661 - 0.433xIn an instrumental variable regression model with one regressor, Xi, andone instrument, Zi, the regression of Xi onto Zi has R2 = 0.1 and n = 50.Is Zi a strong instrument? Would your answer change if R2 = 0.1 and n = 150?Consider a simple linear regression model Y=α+βX+ε. We have collected 15 samples, from which we calculated the summary statistics ∑xi=66, ∑x2i=6568, ∑yi=459, ∑y2i=27933, ∑xiyi=11311. Suppose one of the data is supposed to be (x1=10, y1=30), but is incorrectly recorded as (x1=7, y1=34). All other observations are correctly recorded. What is the OLS estimators αˆ= ? and βˆ= ? based on the correct data.
- 1. Suppose that the sales of a company (Y) is regressed on advertising expenditure (x) and labor cost (z), and the estimated regression equation is Y = 5 + 0.5x + 0.7z + u (where u is the error term). Here, sales, advertising expenditure and labor cost are measured in million Tk. Standard error for the coefficient of x is 0.4, standard error for the coefficient of z is 0.01, and the sample size is 20. Based on this information, find out whether labor cost is a statistically significant variable using an appropriate statistical test.7. in a regression model involving 44 observations, the following estimated regression equation was obtained. Y =29+18 X1 +43 X2 +87 X3 For this model SSR = 600 and SSE = 400 . The critical value of F for testing the significance of the above model at 5% level is A. 2.61 B. 0.67 C. 2.84 D. None E. 8.59Consider the following simple linear regression model: y = β0 + β1x + u. Using a sample of n observations on x and y, you estimate the model by OLS and obtain the estimates βˆ 0, βˆ 1, and the R-squared of the regression, R2 . Then you scale this sample by a factor of 100, obtain a new sample {xi/100; yi/100} for i = 1, . . . , n, re-estimate the model by OLS, and denote the new coefficient estimates by β˜ 0, β˜ 1, and the new R-squared of the regression by R˜2 . a) Give the expression of β˜ 1 in terms of βˆ 1, and justify your answer.
- Consider the following population linear regression model of individual food expenditure: Y = 50 + 0.5X + u, where Y is weekly food expenditure in dollars, X is the individual’s age, and 50+0.5X is the population regression line. Suppose we generate artificial data for 3 individuals using this model. This artificial sample, which consists of 3 observations, is shown in the following table: Answer the following questions. Show your working. (a) What are the values of V1 and V4? (b) Suppose we know that in this artificial sample, the sample covariance between X and Y is 150, and the sample variance of X is 100. Compute the OLS regression line of the regression of Y on X. (Hint: Assume these summary statistics and the OLS regression line continue to hold in parts (c)-(e).) (c) What are the values of V5 and V7?The table below shows the number of state-registered automatic weapons and the murder rate for several Northwestern states, where xx is thousands of automatic weapons and yy is murders per 100,000 residents. xx 11.5 8.5 6.7 3.5 2.9 2.7 2.7 0.9 yy 14.1 11 10 7.3 6.7 6.4 6.4 4.7 Use your calculator to determine the equation of the regression line and write it in the y=ax+by=ax+b form. Round to 2 decimal places. According to this model, how many murders per 100,000 residents can be expected in a state with 10.2 thousand automatic weapons? Round to 3 decimal places. According to this model, how many murders per 100,000 residents can be expected in a state with 5.8 thousand automatic weapons? Round to 3 decimal places.For observed data y=(y1,…,yn)y=(y1,…,yn) with n=21n=21, the above linear regression model was fitted in R, with the following output: >n = 21 >xi = seq(0, n-1,1)/(n-1) >p1 =2*xi-1 >p2 =6*xi^2- 6*xi+1-1/(n-1) > summary(lm(y ~ p1+p2)) Call: lm(formula = y ~ p1 + p2) Residuals: Min 1Q Median 3Q Max -0.5258 -0.2153 0.0813 0.1770 0.4669 Coefficients: Estimate Std. Error t value Pr(>|t|) (Intercept) -0.004238 0.063450 -0.067 0.947 p1 1.181260 0.104784 11.273 1.37e-09 *** p2 -0.953388 0.129422 -7.366 7.77e-07 *** --- Signif. codes: 0 ‘***’ 0.001 ‘**’ 0.01 ‘*’ 0.05 ‘.’ 0.1 ‘ ’ 1 Residual standard error: 0.2908 on 18 degrees of freedom Multiple R-squared: 0.9097, Adjusted R-squared: 0.8997 F-statistic: 90.68 on 2 and 18 DF, p-value: 3.989e-10 Write this linear regression model in the vector form and answer the following questions, using the above R output where necessary.

