(a) The total variation in the sample y-values is given by the (Choose one) which for these data is (Choose one) (b) The value r is the proportion of the total variation in the sample y-values that is explained by the estimated linear relationship between x and y. For these data, the value of r is. (Round your answer to at least 2 decimal places.) The least-squares regression line given above is said to be a line which "best fits" the sample data. The term "best fits" is used because the line has an equation that minimizes the (Choose one) (c) which for these data is (Choose one) V
(a) The total variation in the sample y-values is given by the (Choose one) which for these data is (Choose one) (b) The value r is the proportion of the total variation in the sample y-values that is explained by the estimated linear relationship between x and y. For these data, the value of r is. (Round your answer to at least 2 decimal places.) The least-squares regression line given above is said to be a line which "best fits" the sample data. The term "best fits" is used because the line has an equation that minimizes the (Choose one) (c) which for these data is (Choose one) V

Linear Algebra: A Modern Introduction
4th Edition
ISBN:9781285463247
Author:David Poole
Publisher:David Poole
Chapter7: Distance And Approximation
Section7.3: Least Squares Approximation
Problem 31EQ

Related questions
Question
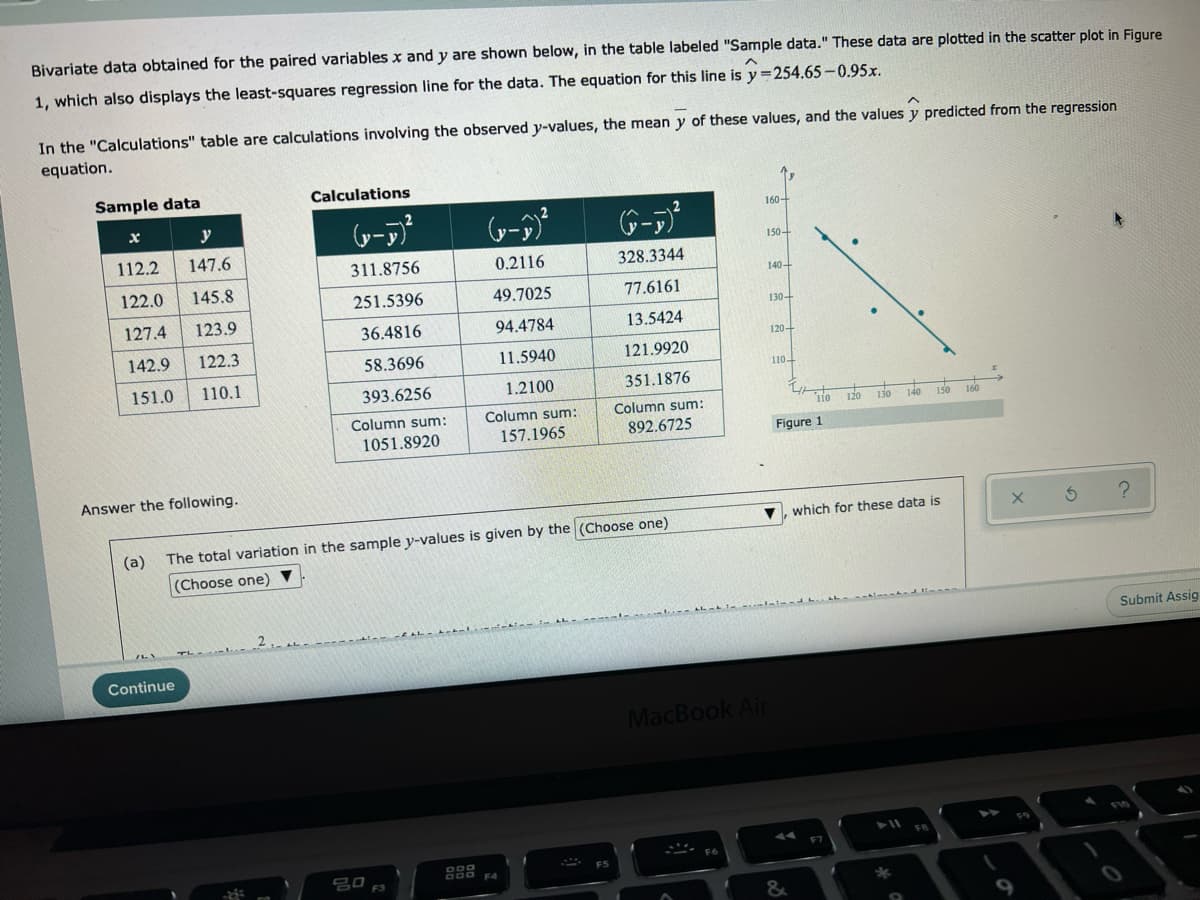
Transcribed Image Text:Bivariate data obtained for the paired variables x and y are shown below, in the table labeled "Sample data." These data are plotted in the scatter plot in Figure
1, which also displays the least-squares regression line for the data. The equation for this line is y=254.65 -0.95x.
In the "Calculations" table are calculations involving the observed y-values, the mean y of these values, and the values y predicted from the regression
equation.
Sample data
Calculations
160+
y
y-y
112.2
147.6
150+
311.8756
0.2116
328.3344
122.0
145.8
140+
251.5396
49.7025
77.6161
127.4
123.9
130+
36.4816
94.4784
13.5424
142.9
122.3
120+
58.3696
11.5940
121.9920
110+
151.0
110.1
393.6256
1.2100
351.1876
Column sum:
Column sum:
Column sum:
110
120 130
140
150
160
1051.8920
157.1965
892.6725
Figure 1
Answer the following.
which for these data is
(a)
The total variation in the sample y-values is given by the (Choose one)
(Choose one)
-. -०० ---
2. .
Submit Assig
TL
Continue
MacBook Air
F10
FB
F6
F5
D00 F4
80,
F3
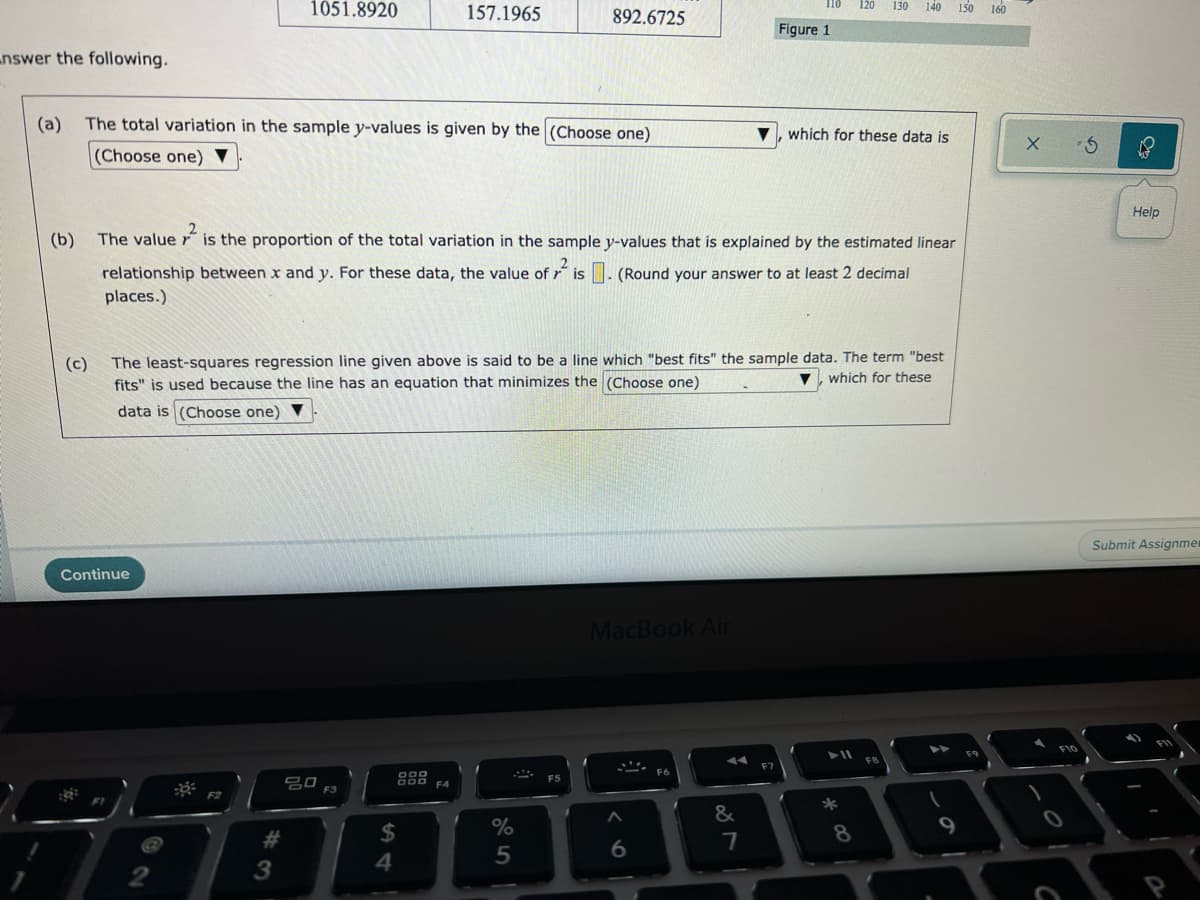
Transcribed Image Text:1051.8920
157.1965
892.6725
130
140
150
160
Figure 1
nswer the following.
(a)
The total variation in the sample y-values is given by the (Choose one)
which for these data is
(Choose one) V
Help
(b)
The value r is the proportion of the total variation in the sample y-values that is explained by the estimated linear
relationship between x and y. For these data, the value of r is. (Round your answer to at least 2 decimal
places.)
The least-squares regression line given above is said to be a line which "best fits" the sample data. The term "best
fits" is used because the line has an equation that minimizes the (Choose one)
(c)
which for these
data is (Choose one)
Submit Assignmer
Continue
MacBook Air
FIO
F9
FB
F7
F5
吕口
F4
F1
*
&
2$
%
8
9
2#
7
4.
Expert Solution
This question has been solved!
Explore an expertly crafted, step-by-step solution for a thorough understanding of key concepts.

This is a popular solution!

Trending now
This is a popular solution!

Step by step
Solved in 2 steps with 4 images

Recommended textbooks for you
Linear Algebra: A Modern Introduction
Algebra
ISBN:
9781285463247
Author:
David Poole
Publisher:
Cengage Learning

College Algebra
Algebra
ISBN:
9781305115545
Author:
James Stewart, Lothar Redlin, Saleem Watson
Publisher:
Cengage Learning

Glencoe Algebra 1, Student Edition, 9780079039897…
Algebra
ISBN:
9780079039897
Author:
Carter
Publisher:
McGraw Hill
Linear Algebra: A Modern Introduction
Algebra
ISBN:
9781285463247
Author:
David Poole
Publisher:
Cengage Learning
College Algebra
Algebra
ISBN:
9781305115545
Author:
James Stewart, Lothar Redlin, Saleem Watson
Publisher:
Cengage Learning
Glencoe Algebra 1, Student Edition, 9780079039897…
Algebra
ISBN:
9780079039897
Author:
Carter
Publisher:
McGraw Hill