A two-tailed hypothesis test for the population mean has two critical values. may have one or two critical values. has only one critical value. may have more than two critical values.
A two-tailed hypothesis test for the population mean has two critical values. may have one or two critical values. has only one critical value. may have more than two critical values.

Holt Mcdougal Larson Pre-algebra: Student Edition 2012
1st Edition
ISBN:9780547587776
Author:HOLT MCDOUGAL
Publisher:HOLT MCDOUGAL
Chapter11: Data Analysis And Probability
Section: Chapter Questions
Problem 8CR

Related questions
Question
100%
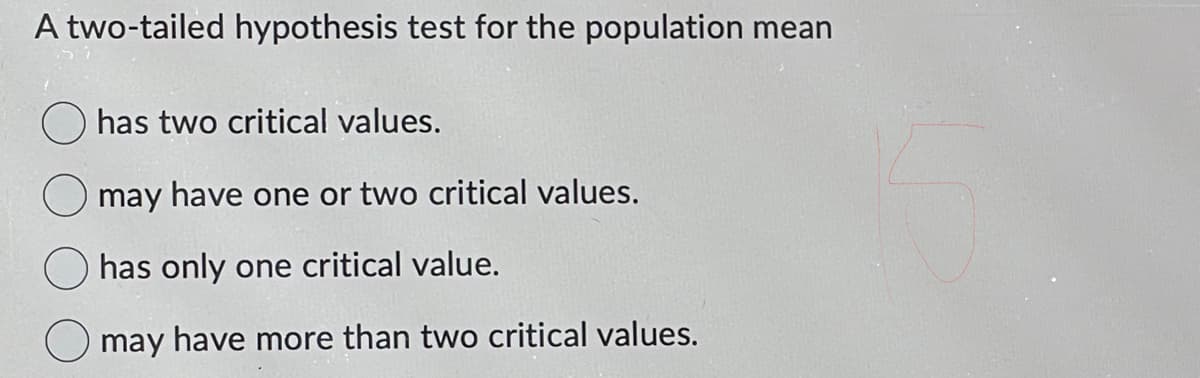
Transcribed Image Text:A two-tailed hypothesis test for the population mean
has two critical values.
may have one or two critical values.
has only one critical value.
O may have more than two critical values.
Expert Solution
This question has been solved!
Explore an expertly crafted, step-by-step solution for a thorough understanding of key concepts.

Step by step
Solved in 2 steps

Recommended textbooks for you
Holt Mcdougal Larson Pre-algebra: Student Edition…
Algebra
ISBN:
9780547587776
Author:
HOLT MCDOUGAL
Publisher:
HOLT MCDOUGAL
Holt Mcdougal Larson Pre-algebra: Student Edition…
Algebra
ISBN:
9780547587776
Author:
HOLT MCDOUGAL
Publisher:
HOLT MCDOUGAL