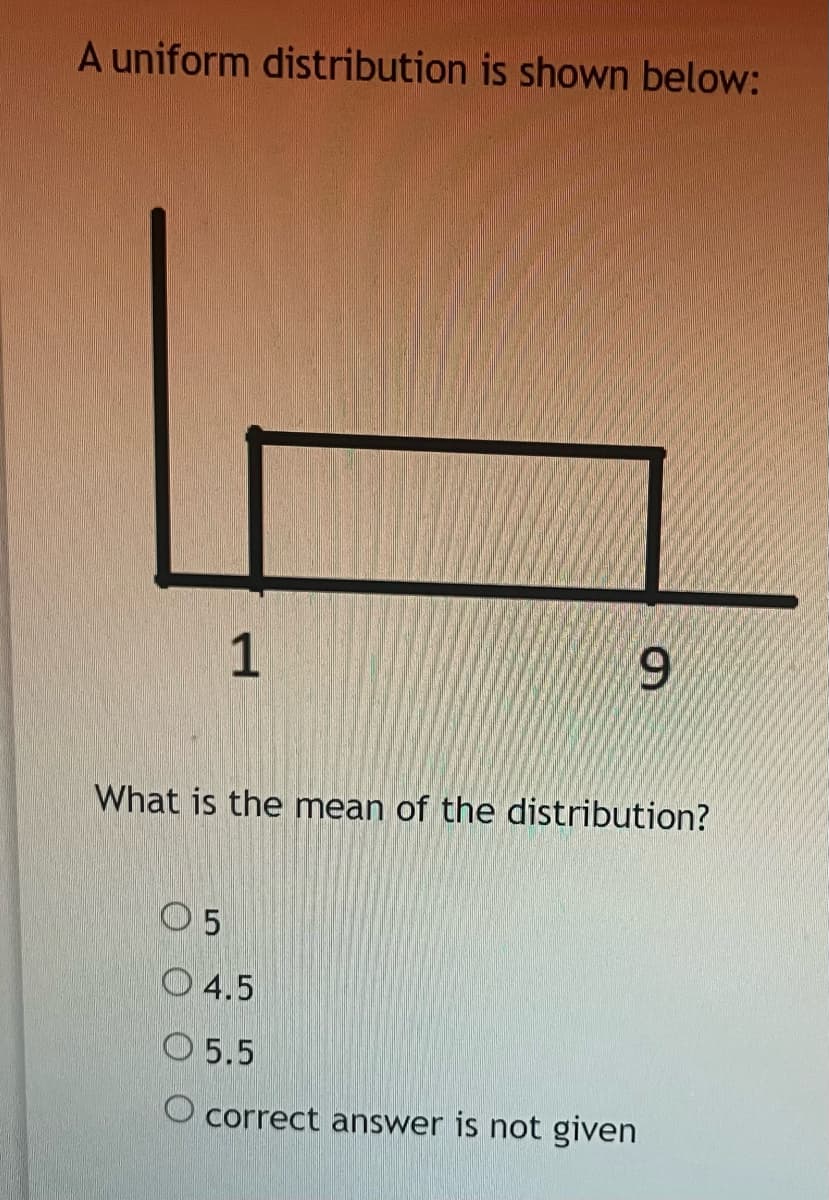
A uniform distribution is shown below: 1 96. What is the mean of the distribution? O 5 O 4.5 O 5.5 O correct answer is not given


Q: Q3. Given the following frequency * ?distribution, What is the mean of the data Frequency 22 15 23…
A: Given : X Frequency 22 15 23 160 24 55 25 15 26 46 Now, the table is obtained to…
Q: Complete the frequency distribution table and then find the standard deviation Repetition Categories…
A: To complete the frequency distribution table and to find the standard deviation: Complete frequency…
Q: The distribution pictured below Is
A: A skewed right distribution is one which the tail is on the right side
Q: Find the value of P if the mean of the following distribution is 12. 13 a: 9 5 7 P 11 f: 6 8 15 9 8…
A: Find p if the mean of distribution is given
Q: 8. Which data set has the greatest sample standard deviation? GeoGebra Calculator a.{30,40,50}…
A: Standard deviation: The positive square root of mean squares of the deviation taken from the…
Q: Calculate the coefficient of variation of a distribution with == 25, *f=21 254 and 2.1= 3804 O…
A:
Q: Determine whether the following statement is true or false. The shape of the distribution shown is…
A: Solution-: The shape of the distribution shown in given graph is best classified as uniform. True or…
Q: The park ranger selects a random sample of 30 aspen trees from the park in 2020 and measures their…
A: a) According to the provided information, Mean (µ) = 8 Standard deviation (σ) = 2.5 Therefore, the…
Q: 5. Which of the following is a measure of the spread of a distribution? a) skewness b) median c)…
A: From the above data We are given that measure of the spread of a distribution The correct option is…
Q: The sampling distribution of the mean is normal in shape. Group of answer choices True False
A: Solution Step 1 False, it is not necessarily true that the shape of the sample mean is not normal.…
Q: was calculated. The pro pling distribution of the
A: p1 = 0.25 p2 =0.22 n1 = 100 n2 = 100
Q: a) Find the number of customers in this sample who had waist sizes from 30-36 inches. b) Is this…
A:
Q: For a distribution, the CV is 25.5% and the S.D is 8.5. Calculate the value of the mean. O a. 5.77 O…
A: Answer: ⊙ b. 33.33 The value of the mean is 33.33.
Q: 4. Find each value requested for the distribution of scores in the following table. 6 1 5 2 4 2 3 4…
A: Given: The data given is as follows X f 6 1 5 2 4 2 3 4 2 3 1 2
Q: For the following frequency distribution, how many individual scores are in the entire set?
A: In this question, we use the given frequency table to find the * total score * sum of x The…
Q: Determine the shape of the sampling distribution of the sample mean given the following information:…
A: From the provided information, The shape of the population is normal with sample size (n) = 100
Q: The number of cartoons watched by Ms. Smith's first grade class on Saturday morning is shown below.…
A:
Q: 4. Given n > 30 and o is known. What is the appropriate distribution? C.p D. r B. t
A: Solution: 4. The conditions for using Z distribution are: Sample size should be large. Population…
Q: 5. For the following distribution of survey scores, how many individuals participated in the survey?…
A: Given that The frequency distribution of survey scores. X f (Frequency) 5-Strongly agree 5…
Q: a. What is the distribution of ? x ~ NO - 5.0877 X b. What is the distribution of Σ? Σ - N( x…
A: It is given that Mean, μ = 21.2 Standard deviation, σ = 9.3 Sample size, n = 17 Note: According…
Q: a. What is the distribution of U = Y?? Explain using the concepts discussed in class. b. What is the…
A:
Q: 3. Find each value requested for the distribution of scores in the following table. 4 3 3 4 2 5 1 2…
A: a) The number of values are 5, so n=5 b) The value of ∑ix=1+2+3+4+5=15
Q: What number completes the folloming distribution containing 3 trials? P(X) 0.25 0.35 0.30
A: Given data, What is the probability that distribution contains 3 trials?
Q: A uniform distribution is shown below: 1 9 What is the mean of the distribution? O 5 4.5 5.5 correct…
A:
Q: Find the mean, μ, for the binomial distribution which has the stated values of n and p. Round answer…
A:
Q: Find Standard Deviation for the following frequency distribution 10 11 12 13 14 Total 3 12 18 12 48
A:
Q: 1 2
A: According to the sum, Participant Hours(Xi) 1 5 2 6.5 3 6 4 8 5 6 6 6 7 6 8 8 9…
Q: Based on the given table below, what is the mode? Table 1. Distribution According to Favorite…
A: Given that,
Q: For a sample of 12 offenders convicted of weapons violations, the length of prison sentence in…
A: Solution-: Given data: 6,6,2,12,17,48,60,24,20,20,18,15 What is the shape of this given…
Q: Find the standard deviation error of the mean for each sampling situation a) o=56, n=4
A:
Q: Consider the distribution below. Compute for the mean and variance. 10 20 30 40 50 P(x) 5% 5% 25%…
A: Given data is x 0 10 20 30 40 50 P(x) 5% 5% 25% 20% 30% 15%
Q: a. How many students got a score of 26 or below? b. What points divides the distribution such that…
A: The median (Q2) value divides the distribution such that half is below it and half is above. The…
Q: Find the mean,median,and mode for the following frequency distribution table x 5,4,3,2,1,0 f…
A: We have given that, The frequency distribution table : x: 5 4 3 2 1 0 f: 2 5 2 3 0 2…
Q: Using the frequency distribution table below, what is the proportion of individuals that scored a 4?…
A: Given data is x f 6 4 5 3 4 7 3 2 2 2 1 2
Q: Which of the following best describes the form of the sampling distribution of the sample…
A:
Q: a. What is the distribution of X? X N( b. What is the median giraffe height? ft. c. What is the…
A: Define the random variable, X : Height of an adult Given that the Height of an adult follows a…
Q: for the sample of scores in the following frequency distribution table what is the mean? x 5 4 3 2…
A:
Q: Find the mean of the distribution shown below. 3. 7 P(X) 0.21 0.07 0.58 0.14 O 6.23 0.25 O 24
A: To find the mean of the distribution
Q: For the uniform distribution below, what proportion of values are located between 12.3 and 18.6?…
A:
Q: For a distribution, the CV is 25.5% and the S.D is 8.5. Calculate the value of the mean. O a.57.7 O…
A: Coefficient of variation (CV)=σx¯*100wherex¯=meanσ=standard deviation
Q: P(x) 0.03 1 0.07 2 0.33 3 0.36 0.08 0.13 5.
A: Mean(x)=∑x·P(x) Calculating x*P(x) x P(x) x*P(x) 0 0.03 0 1 0.07 0.07 2 0.33 0.66 3 0.36…
Q: A. Find the mean and standard de the sampling distribution of p,- P. Justify your answer.
A: The mean is given by p1 - p2 = 0.86 - 0.54 p1 - p2 = 0.32 The standard deviation of the sampling…
Q: The sampling distribution of the mean depends on the sample size. O False O true
A: t distribution will follow on sample size less than 30 and sample size equal or greater than 30 then…
Q: Set up the following scores into a grouped frequency distribution. Obtain relative frequency and…
A:
Q: There Is an average of 4 accidents in a week on a major highway in the city. Wnat is the standard…
A:
Q: Identify the shape of the following distributions: 1. 2. 3. 4. 5.
A: Given that
Q: are are iChi-square distribution table Degrees of Freedom 0.995 0.99 0.975
A: Level of significancce = 0.01 Human activity Natural patterns Don't know Total Male 315 172…
Q: The following data are given to you to find out whether the distribution is platykurtic N= 100, Efd,…
A: Concentration of all the values around the central value of the given data is known as measures of…
Q: Identify the original scores in the following stem and leaf display: Stem | Leaf 1 | 4…
A: (a) To identify the shape of the distribution: A symmetric, unimodal, bell shaped curve indicates a…

Step by step
Solved in 2 steps with 2 images
