A university conducted a study of whether running is healthy for men and women over age 50. During the first eight years of the study, 1.7% of the 455 members of a fitness association died. We are interested in the proportion of people over 50 who ran and died in the same eight-year period. NOTE: If you are using a Student's t-distribution, you may assume that the underlying population is normally distributed. (In general, you must first prove that assumption, though.) O Part (a) Define the Random Variables X and P', in words. O Xis the proportion of all runners that die, and P'is the number of all runners that die. O Xis the proportion of people who ran and died in the eight-year period, and P'is the number of people who ran and died in the eight-year period. O Xis the number of all runners that die, and P' is the proportion of all runners that die. O Xis the number of people who ran and died in the eight-year period, and P'is the proportion of people who ran and died in the eight-year period. O Part (b) Which distribution should you use for this problem? (Round your answers to four decimal places.) P-O Explain your choice. O The Student's t-distribution should be used because V npg s 10, which implies a small sample. O The standard normal distribution should be used because we are interested in proportions. O The binomial distribution should be used because the two outcomes are "the runner died" and "the runner did not die." O The Student's t-distribution should be used because we do not know the standard deviation.
A university conducted a study of whether running is healthy for men and women over age 50. During the first eight years of the study, 1.7% of the 455 members of a fitness association died. We are interested in the proportion of people over 50 who ran and died in the same eight-year period. NOTE: If you are using a Student's t-distribution, you may assume that the underlying population is normally distributed. (In general, you must first prove that assumption, though.) O Part (a) Define the Random Variables X and P', in words. O Xis the proportion of all runners that die, and P'is the number of all runners that die. O Xis the proportion of people who ran and died in the eight-year period, and P'is the number of people who ran and died in the eight-year period. O Xis the number of all runners that die, and P' is the proportion of all runners that die. O Xis the number of people who ran and died in the eight-year period, and P'is the proportion of people who ran and died in the eight-year period. O Part (b) Which distribution should you use for this problem? (Round your answers to four decimal places.) P-O Explain your choice. O The Student's t-distribution should be used because V npg s 10, which implies a small sample. O The standard normal distribution should be used because we are interested in proportions. O The binomial distribution should be used because the two outcomes are "the runner died" and "the runner did not die." O The Student's t-distribution should be used because we do not know the standard deviation.

Holt Mcdougal Larson Pre-algebra: Student Edition 2012
1st Edition
ISBN:9780547587776
Author:HOLT MCDOUGAL
Publisher:HOLT MCDOUGAL
Chapter11: Data Analysis And Probability
Section: Chapter Questions
Problem 8CR

Related questions

Question
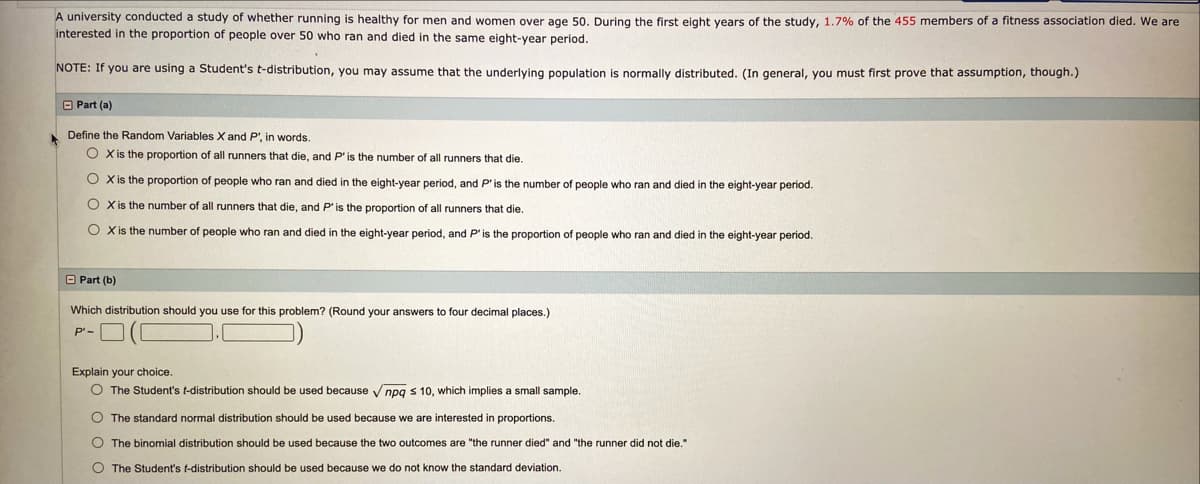
Transcribed Image Text:A university conducted a study of whether running is healthy for men and women over age 50. During the first eight vears of the study, 1.7% of the 455 members of a fitness association died. We are
interested in the proportion of people over 50 who ran and died in the same eight-year period.
NOTE: If you are using a Student's t-distribution, you may assume that the underlving population is normally distributed. (In general, you must first prove that assumption, though.)
O Part (a)
Define the Random Variables X and P', in words.
O X is the proportion of all runners that die, and P'is the number of all runners that die.
O X is the proportion of people who ran and died in the eight-year period, and P'is the number of people who ran and died in the eight-year period.
O Xis the number of all runners that die, and P'is the proportion of all runners that die.
O Xis the number of people who ran and died in the eight-year period, and P'is the proportion of people who ran and died in the eight-year period.
O Part (b)
Which distribution should you use for this problem? (Round your answers
four decimal places.)
P'-
Explain your choice.
O The Student's t-distribution should be used because
npq s 10, which implies a small sample.
O The standard normal distribution should be used because we are interested in proportions.
O The binomial distribution should be used because the two outcomes are "the runner died" and "the runner did not die."
O The Student's t-distribution should be used because we do not know the standard deviation.
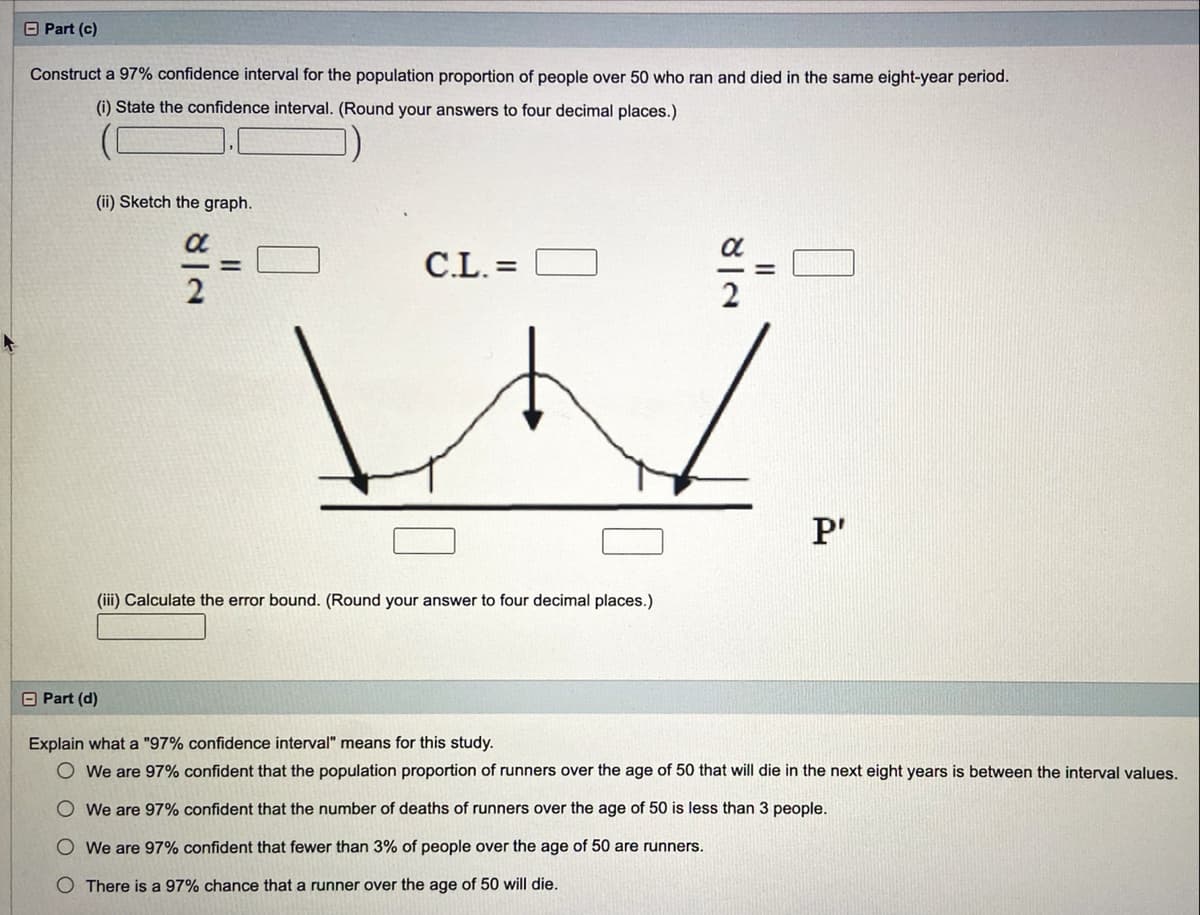
Transcribed Image Text:O Part (c)
Construct a 97% confidence interval for the population proportion of people over 50 who ran and died in the same eight-year period.
(i) State the confidence interval. (Round your answers to four decimal places.)
(ii) Sketch the graph.
C.L. =
2
2
P'
(iii) Calculate the error bound. (Round your answer to four decimal places.)
O Part (d)
Explain what a "97% confidence interval" means for this study.
We are 97% confident that the population proportion of runners over the age of 50 that will die in the next eight years is between the interval values.
O We are 97% confident that the number of deaths of runners over the age of 50 is less than 3 people.
O We are 97% confident that fewer than 3% of people over the age of 50 are runners.
O There is a 97% chance that a runner over the age of 50 will die.
Expert Solution
This question has been solved!
Explore an expertly crafted, step-by-step solution for a thorough understanding of key concepts.

This is a popular solution!

Trending now
This is a popular solution!

Step by step
Solved in 2 steps with 5 images

Knowledge Booster


Learn more about
Need a deep-dive on the concept behind this application? Look no further. Learn more about this topic, statistics and related others by exploring similar questions and additional content below.Recommended textbooks for you
Holt Mcdougal Larson Pre-algebra: Student Edition…
Algebra
ISBN:
9780547587776
Author:
HOLT MCDOUGAL
Publisher:
HOLT MCDOUGAL

Glencoe Algebra 1, Student Edition, 9780079039897…
Algebra
ISBN:
9780079039897
Author:
Carter
Publisher:
McGraw Hill
Holt Mcdougal Larson Pre-algebra: Student Edition…
Algebra
ISBN:
9780547587776
Author:
HOLT MCDOUGAL
Publisher:
HOLT MCDOUGAL
Glencoe Algebra 1, Student Edition, 9780079039897…
Algebra
ISBN:
9780079039897
Author:
Carter
Publisher:
McGraw Hill