(a) What is a "7-day rolling average"? Explain what the graphs are showing. (b) Are C(t) and D(t) functions or not? Explain your answer. (c) Your friend looks at the graphs and says that it is strange because on 29 March 2020 the deaths are higher than the confirmed cases. So, more people are dying than are ill. Is this a true observation? Explain.
(a) What is a "7-day rolling average"? Explain what the graphs are showing. (b) Are C(t) and D(t) functions or not? Explain your answer. (c) Your friend looks at the graphs and says that it is strange because on 29 March 2020 the deaths are higher than the confirmed cases. So, more people are dying than are ill. Is this a true observation? Explain.

Linear Algebra: A Modern Introduction
4th Edition
ISBN:9781285463247
Author:David Poole
Publisher:David Poole
Chapter2: Systems Of Linear Equations
Section2.4: Applications
Problem 2EQ: 2. Suppose that in Example 2.27, 400 units of food A, 500 units of B, and 600 units of C are placed...

Related questions
Topic Video
Question
100%
![1. Countries across the world have been reporting the number of people who are confirmed
to have Covid-19 and the number of people who have died with the disense. The graphs
below show such numbers for Italy between January and October 2020.
The blue line depicts the number of confirmed cases of Covid-19 and the red line the
number of deaths. We call these two C(t) and D(t) respectively, where t is time measured
in days since 5 January 2020. (So t =0 is the start of 5 January 2020-Le. midnight on
4 January 2020 and t= 148 would be the start of June, midnight of 31 May 2020.)
[Downloaded from https://newseu.egtn.com/on 12.01.2021.]
ITALY CASES AND DEATHS SINCE JANUARY 2020
Total 7-day rolling average
20,000
16,000
16.000
900
14,000
12.000
701
10,000
500
4.000
100
30 Aug
13 5ep
27 Sep
Deaths](/v2/_next/image?url=https%3A%2F%2Fcontent.bartleby.com%2Fqna-images%2Fquestion%2Fa1aaa9c2-f3a4-46f3-ab5a-c0345c7d0a89%2Fe4842068-c992-41af-94e3-2e03c3dab1e0%2Foqg8qxm_processed.jpeg&w=3840&q=75)
Transcribed Image Text:1. Countries across the world have been reporting the number of people who are confirmed
to have Covid-19 and the number of people who have died with the disense. The graphs
below show such numbers for Italy between January and October 2020.
The blue line depicts the number of confirmed cases of Covid-19 and the red line the
number of deaths. We call these two C(t) and D(t) respectively, where t is time measured
in days since 5 January 2020. (So t =0 is the start of 5 January 2020-Le. midnight on
4 January 2020 and t= 148 would be the start of June, midnight of 31 May 2020.)
[Downloaded from https://newseu.egtn.com/on 12.01.2021.]
ITALY CASES AND DEATHS SINCE JANUARY 2020
Total 7-day rolling average
20,000
16,000
16.000
900
14,000
12.000
701
10,000
500
4.000
100
30 Aug
13 5ep
27 Sep
Deaths
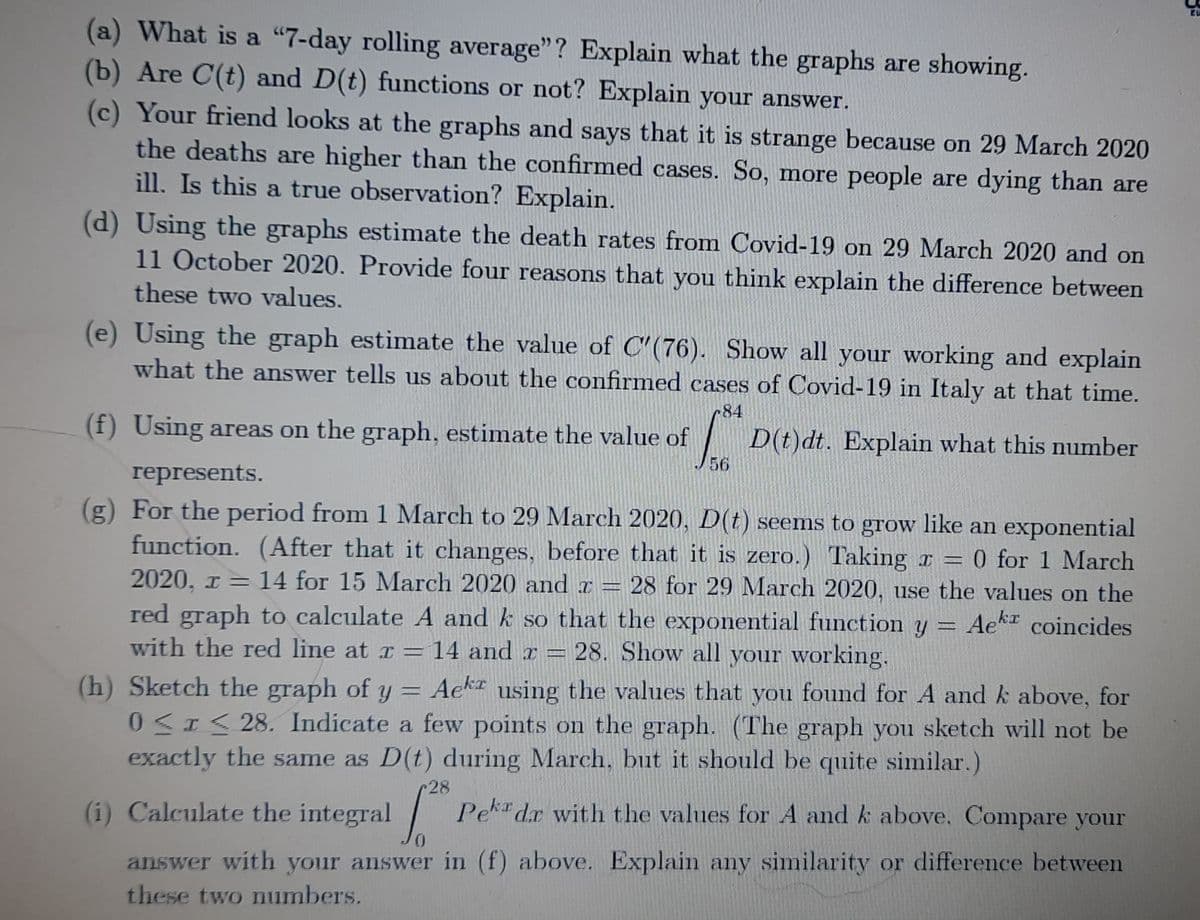
Transcribed Image Text:(a) What is a "7-day rolling average"? Explain what the graphs are showing.
(b) Are C(t) and D(t) functions or not? Explain your answer.
(c) Your friend looks at the graphs and says that it is strange because on 29 March 2020
the deaths are higher than the confirmed cases. So, more people are dying than are
ill. Is this a true observation? Explain.
(d) Using the graphs estimate the death rates from Covid-19 on 29 March 2020 and on
11 October 2020. Provide four reasons that you think explain the difference between
these two values.
(e) Using the graph estimate the value of C'(76). Show all your working and explain
what the answer tells us about the confirmed cases of Covid-19 in Italy at that time.
84
(f) Using areas on the graph, estimate the value of
D(t)dt. Explain what this number
56
represents.
(g) For the period from 1 March to 29 March 2020, D(t) seems to grow like an exponential
function. (After that it changes, before that it is zero.) Taking r = 0 for 1 March
2020. I= 14 for 15 March 2020 and a = 28 for 29 March 2020, use the values on the
red graph to calculate A and k so that the exponential function y = Ae* coincides
with the red line at r = 14 and r = 28. Show all your working.
(h) Sketch the graph of y = Aek using the values that you found for A and k above, for
0<I 28. Indicate a few points on the graph. (The graph you sketch will not be
exactly the same as D(t) during March, but it should be quite similar.)
%3D
28
(i) Calculate the integral Pe dr with the values for A and k above. Compare your
0.
answer with your answer in (f) above. Explain any similarity or difference between
these two numbers.
Expert Solution
This question has been solved!
Explore an expertly crafted, step-by-step solution for a thorough understanding of key concepts.

Step by step
Solved in 3 steps

Knowledge Booster


Learn more about
Need a deep-dive on the concept behind this application? Look no further. Learn more about this topic, advanced-math and related others by exploring similar questions and additional content below.Recommended textbooks for you
Linear Algebra: A Modern Introduction
Algebra
ISBN:
9781285463247
Author:
David Poole
Publisher:
Cengage Learning

Algebra & Trigonometry with Analytic Geometry
Algebra
ISBN:
9781133382119
Author:
Swokowski
Publisher:
Cengage
Linear Algebra: A Modern Introduction
Algebra
ISBN:
9781285463247
Author:
David Poole
Publisher:
Cengage Learning
Algebra & Trigonometry with Analytic Geometry
Algebra
ISBN:
9781133382119
Author:
Swokowski
Publisher:
Cengage