a) What is the false positive rate of the home test? b) What is the positive predictive value of the home test? c) What is the false negative rate of the home test?
a) What is the false positive rate of the home test? b) What is the positive predictive value of the home test? c) What is the false negative rate of the home test?

Algebra & Trigonometry with Analytic Geometry
13th Edition
ISBN:9781133382119
Author:Swokowski
Publisher:Swokowski
Chapter10: Sequences, Series, And Probability
Section10.8: Probability
Problem 31E

Related questions
Question
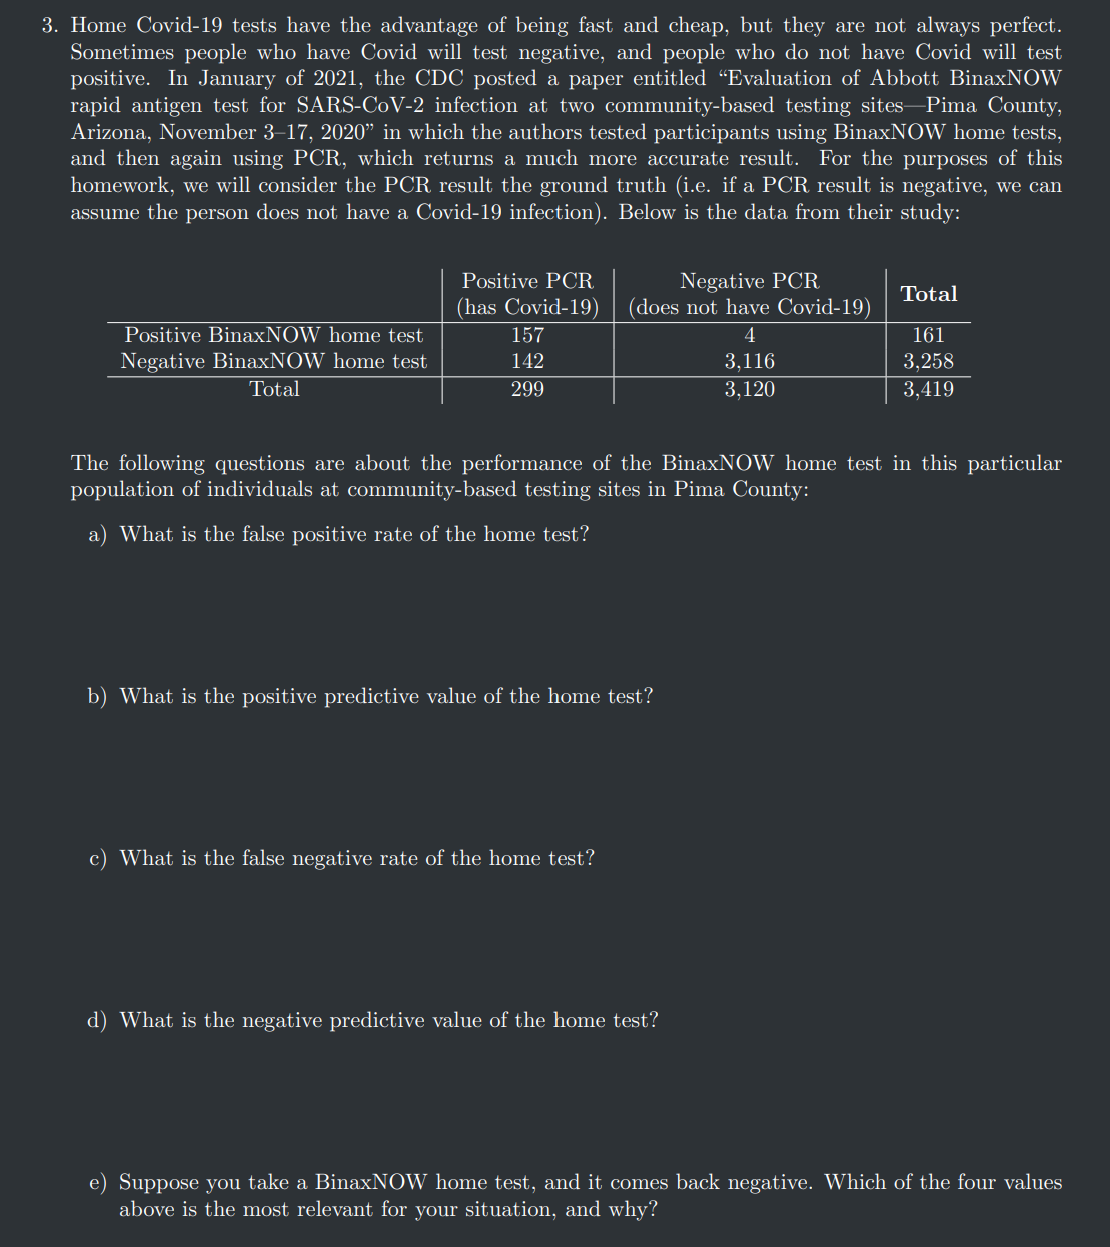
Transcribed Image Text:3. Home Covid-19 tests have the advantage of being fast and cheap, but they are not always perfect.
Sometimes people who have Covid will test negative, and people who do not have Covid will test
positive. In January of 2021, the CDC posted a paper entitled “Evaluation of Abbott BinaxNOW
rapid antigen test for SARS-CoV-2 infection at two community-based testing sites-Pima County,
Arizona, November 3-17, 2020" in which the authors tested participants using BinaxNOW home tests,
and then again using PCR, which returns a much more accurate result. For the purposes of this
homework, we will consider the PCR result the ground truth (i.e. if a PCR result is negative, we can
assume the person does not have a Covid-19 infection). Below is the data from their study:
Positive BinaxNOW home test
Negative BinaxNOW home test
Total
Positive PCR
(has Covid-19)
157
142
299
Negative PCR
(does not have Covid-19)
4
3,116
3,120
NOW
The following questions are about the performance of the
population of individuals at community-based testing sites in Pima County:
a) What is the false positive rate of the home test?
b) What is the positive predictive value of the home test?
c) What is the false negative rate of the home test?
d) What is the negative predictive value of the home test?
test
Total
161
3,258
3,419
this particular
e) Suppose you take a BinaxNOW home test, and it comes back negative. Which of the four values
above is the most relevant for your situation, and why?
Expert Solution
Step 1
AS PER GUIDELINES I HAVE CALCULATED FIRST 3 SUBPARTS .
Here given result of covid test using PCR and BinaxNow home test.

Step by step
Solved in 4 steps with 3 images

Follow-up Questions
Read through expert solutions to related follow-up questions below.
Follow-up Question
D) What is the negative predictive value of the home test?
E)Suppose you take a BinaxNOW home test and it comes back negative. Which of the four values above is the most relevant for your situation and why?
Solution
Recommended textbooks for you
Algebra & Trigonometry with Analytic Geometry
Algebra
ISBN:
9781133382119
Author:
Swokowski
Publisher:
Cengage
Algebra & Trigonometry with Analytic Geometry
Algebra
ISBN:
9781133382119
Author:
Swokowski
Publisher:
Cengage