(a) What type of shape did you assume for the sampling distribution for sample mean and on what ground? Write down two properties of the type of distribution you assumed. (b) What is the probability that the mean time spent working per week for this sample of students will be between 18 hours and 21 hours? (c) Show both the population distribution and sampling distribution of sample mean in a single graph.
(a) What type of shape did you assume for the sampling distribution for sample mean and on what ground? Write down two properties of the type of distribution you assumed. (b) What is the probability that the mean time spent working per week for this sample of students will be between 18 hours and 21 hours? (c) Show both the population distribution and sampling distribution of sample mean in a single graph.

Glencoe Algebra 1, Student Edition, 9780079039897, 0079039898, 2018
18th Edition
ISBN:9780079039897
Author:Carter
Publisher:Carter
Chapter10: Statistics
Section10.4: Distributions Of Data
Problem 19PFA

Related questions
Question
Introduction to Statistics (Bus-172)
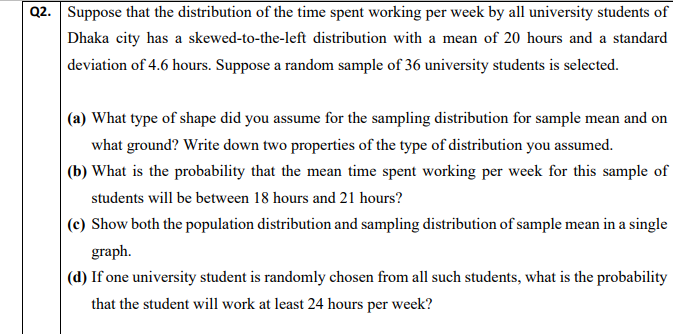
Transcribed Image Text:Q2. Suppose that the distribution of the time spent working per week by all university students of
Dhaka city has a skewed-to-the-left distribution with a mean of 20 hours and a standard
deviation of 4.6 hours. Suppose a random sample of 36 university students is selected.
(a) What type of shape did you assume for the sampling distribution for sample mean and on
what ground? Write down two properties of the type of distribution you assumed.
(b) What is the probability that the mean time spent working per week for this sample of
students will be between 18 hours and 21 hours?
(c) Show both the population distribution and sampling distribution of sample mean in a single
graph.
(d) If one university student is randomly chosen from all such students, what is the probability
that the student will work at least 24 hours per week?
Expert Solution
This question has been solved!
Explore an expertly crafted, step-by-step solution for a thorough understanding of key concepts.

Step by step
Solved in 4 steps with 4 images

Recommended textbooks for you
Glencoe Algebra 1, Student Edition, 9780079039897…
Algebra
ISBN:
9780079039897
Author:
Carter
Publisher:
McGraw Hill
Glencoe Algebra 1, Student Edition, 9780079039897…
Algebra
ISBN:
9780079039897
Author:
Carter
Publisher:
McGraw Hill