A world wide fast food chain decided to carry out an experiment to assess the influence of income on number of visits to their restaurants or vice versa. A sample of households was asked about the number of times they visit a fast food restaurant (X) during last month as well as their monthly income (Y). The data presented in the following table are the sums and sum of squares. (use 2 digits after decimal point) ∑ Y = 393 ∑ Y2 = 21027 ∑ ( Y-Ybar )2 = SSY = 1720.88 ∑ X = 324 ∑ X2 = 14272 ∑ ( X-Xbar )2 = SSX = 1150 nx=8 ny=11 ∑ [ ( X-Xbar )( Y-Ybar) ] =SSXY=1090.5 PART A Sample mean income is Answer Sample standard deviation of income is Answer 90% confidence interval for the population mean income (hint: assume that income distributed normally with mean μ and variance σ2) is [Answer±Answer*Answer] 90% confidence interval for the population variance of income (hint: assume that income distributed normally with mean μ and variance σ2) is [Answer to Answer]


Inverse Normal Distribution
The method used for finding the corresponding z-critical value in a normal distribution using the known probability is said to be an inverse normal distribution. The inverse normal distribution is a continuous probability distribution with a family of two parameters.
Mean, Median, Mode
It is a descriptive summary of a data set. It can be defined by using some of the measures. The central tendencies do not provide information regarding individual data from the dataset. However, they give a summary of the data set. The central tendency or measure of central tendency is a central or typical value for a probability distribution.
Z-Scores
A z-score is a unit of measurement used in statistics to describe the position of a raw score in terms of its distance from the mean, measured with reference to standard deviation from the mean. Z-scores are useful in statistics because they allow comparison between two scores that belong to different normal distributions.
A world wide fast food chain decided to carry out an experiment to assess the influence of income on number of visits to their restaurants or vice versa. A sample of households was asked about the number of times they visit a fast food restaurant (X) during last month as well as their monthly income (Y). The data presented in the following table are the sums and sum of squares. (use 2 digits after decimal point)
|
∑ Y = 393 |
∑ Y2 = 21027 |
∑ ( Y-Ybar )2 = SSY = 1720.88 |
|
∑ X = 324 |
∑ X2 = 14272 |
∑ ( X-Xbar )2 = SSX = 1150 |
|
nx=8 |
ny=11 |
∑ [ ( X-Xbar )( Y-Ybar) ] =SSXY=1090.5 |
PART A
Sample
Sample standard deviation of income is Answer
90% confidence interval for the population mean income (hint: assume that income distributed normally with mean μ and variance σ2) is [Answer±Answer*Answer]
90% confidence interval for the population variance of income (hint: assume that income distributed normally with mean μ and variance σ2) is [Answer to Answer]
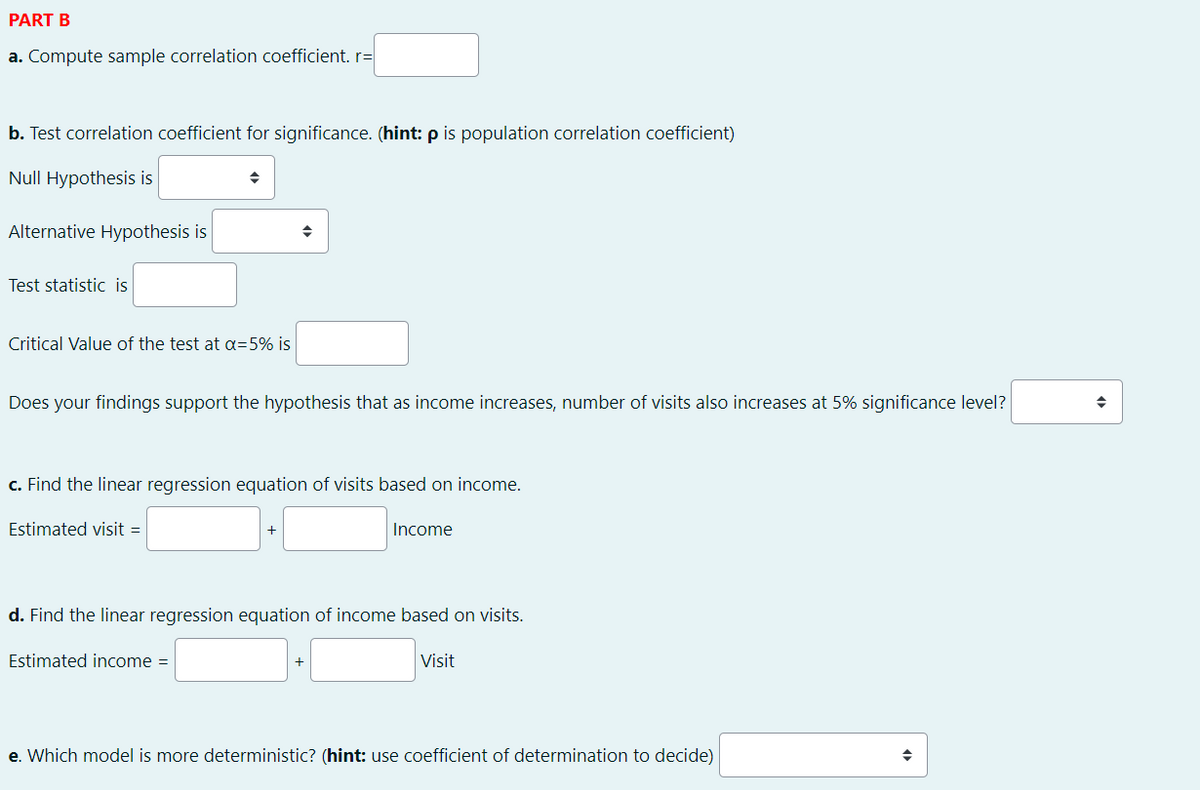
PART B
a. Compute sample
b. Test correlation coefficient for significance. (hint: ρ is population correlation coefficient)
Null Hypothesis is Answer
Alternative Hypothesis is Answer
Test statistic is Answer
Critical Value of the test at α=5% is Answer
Does your findings support the hypothesis that as income increases, number of visits also increases at 5% significance level? Answer
c. Find the linear regression equation of visits based on income.
Estimated visit = Answer + Answer Income
d. Find the linear regression equation of income based on visits.
Estimated income = Answer + Answer Visit
e. Which model is more deterministic? (hint: use coefficient of determination to decide) Answer
![A world wide fast food chain decided to carry out an experiment to assess the influence of income on number of visits to their restaurants or vice
versa. A sample of households was asked about the number of times they visit a fast food restaurant (X) during last month as well as their monthly
income (Y). The data presented in the following table are the sums and sum of squares. (use 2 digits after decimal point)
5Y = 393
5Y2 = 21027 5(Y-Ybar )? = SSY = 1720.88
EX = 324
Ex2 = 14272 E(X-Xbar )? = SSX = 1150
E[(X-Xbar )( Y-Ybar) ]
|=SSXY=1090.5
nx=8
ny=11
PART A
Sample mean income is
Sample standard deviation of income is
90% confidence interval for the population mean income (hint: assume that income distributed normally with mean u and variance o2) is [
90% confidence interval for the population variance of income (hint: assume that income distributed normally with mean u and variance o?) is [
to
PART B](/v2/_next/image?url=https%3A%2F%2Fcontent.bartleby.com%2Fqna-images%2Fquestion%2Fb82422cb-9f9a-4a7b-b628-ff5016080d0f%2F85962092-82a5-4a15-bdc3-283ac7cba6bd%2F9k7s02h_processed.png&w=3840&q=75)

Step by step
Solved in 5 steps with 5 images


