a. A researcher collects a sample of 15 measurements from a Normally distributed population and wishes to find a 99% confidence interval for the population mean. What valu should he use for t*? b. If he instead decides to use a 95% confidence interval, will the interval be wider or be narrower or stay the same? Why? E Click the icon to view the t-table. a. To find a 99% confidence interval for the population mean, he should use for t*. (Round to three decimal places as needed.) b. If he instead decides to use a 95% confidence interval, will the interval be wider, be narrower, or stay the same? Why? O A. The interval will be narrower because t* is smaller, which makes the margin of error smaller. O B. The interval will be wider because t* is smaller, which makes the margin of error bigger. OC. The interval will be narrower because t is bigger, which makes the margin of error smaller. O D. The interval will be wider because t is bigger, which makes the margin of error bigger.
a. A researcher collects a sample of 15 measurements from a Normally distributed population and wishes to find a 99% confidence interval for the population mean. What valu should he use for t*? b. If he instead decides to use a 95% confidence interval, will the interval be wider or be narrower or stay the same? Why? E Click the icon to view the t-table. a. To find a 99% confidence interval for the population mean, he should use for t*. (Round to three decimal places as needed.) b. If he instead decides to use a 95% confidence interval, will the interval be wider, be narrower, or stay the same? Why? O A. The interval will be narrower because t* is smaller, which makes the margin of error smaller. O B. The interval will be wider because t* is smaller, which makes the margin of error bigger. OC. The interval will be narrower because t is bigger, which makes the margin of error smaller. O D. The interval will be wider because t is bigger, which makes the margin of error bigger.

Glencoe Algebra 1, Student Edition, 9780079039897, 0079039898, 2018
18th Edition
ISBN:9780079039897
Author:Carter
Publisher:Carter
Chapter10: Statistics
Section10.4: Distributions Of Data
Problem 19PFA

Related questions

Question
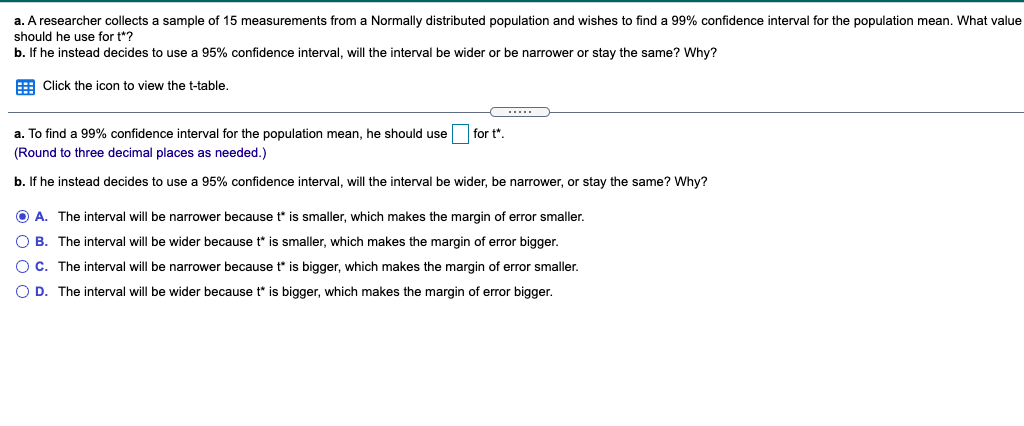
Transcribed Image Text:a. A researcher collects a sample of 15 measurements from a Normally distributed population and wishes to find a 99% confidence interval for the population mean. What value
should he use for t*?
b. If he instead decides to use a 95% confidence interval, will the interval be wider or be narrower or stay the same? Why?
E Click the icon to view the t-table.
a. To find a 99% confidence interval for the population mean, he should use
for t*.
(Round to three decimal places as needed.)
b. If he instead decides to use a 95% confidence interval, will the interval be wider, be narrower, or stay the same? Why?
O A. The interval will be narrower because t is smaller, which makes the margin of error smaller.
O B. The interval will be wider because t* is smaller, which makes the margin of error bigger.
O C. The interval will be narrower because t* is bigger, which makes the margin of error smaller.
O D. The interval will be wider because t* is bigger, which makes the margin of error bigger.
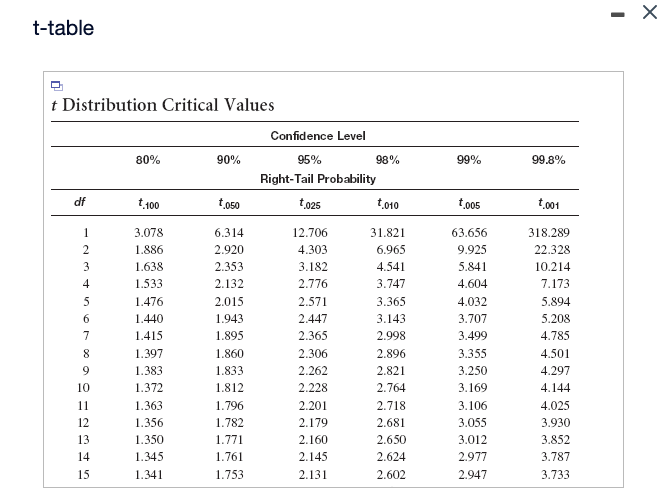
Transcribed Image Text:t-table
t Distribution Critical Values
Confidence Level
80%
90%
95%
98%
99%
99.8%
Right-Tail Probability
df
t,100
to50
t,025
to10
t,o05
t,001
1
3.078
6.314
12.706
31.821
63.656
318.289
2.
1.886
2.920
4.303
6.965
9.925
22.328
3
1.638
2.353
3.182
4.541
5.841
10.214
4
1.533
2.132
2.776
3.747
4.604
7.173
1.476
2.015
2.571
3.365
4.032
5.894
1.440
1.943
2.447
3.143
3.707
5.208
7
1.415
1.895
2.365
2.998
3.499
4.785
8.
1.397
1.860
2.306
2.896
3.355
4.501
1.383
1.833
2.262
2.821
3.250
4.297
10
1.372
1.812
2.228
2.764
3.169
4.144
11
1.363
1.796
2.201
2.718
3.106
4.025
12
1.356
1.782
2.179
2.681
3.055
3.930
13
1.350
1.771
2.160
2.650
3.012
3.852
14
1.345
1.761
2.145
2.624
2.977
3.787
15
1.341
1.753
2.131
2.602
2.947
3.733
Expert Solution
This question has been solved!
Explore an expertly crafted, step-by-step solution for a thorough understanding of key concepts.

This is a popular solution!

Trending now
This is a popular solution!

Step by step
Solved in 2 steps with 1 images

Knowledge Booster


Learn more about
Need a deep-dive on the concept behind this application? Look no further. Learn more about this topic, statistics and related others by exploring similar questions and additional content below.Recommended textbooks for you
Glencoe Algebra 1, Student Edition, 9780079039897…
Algebra
ISBN:
9780079039897
Author:
Carter
Publisher:
McGraw Hill
Glencoe Algebra 1, Student Edition, 9780079039897…
Algebra
ISBN:
9780079039897
Author:
Carter
Publisher:
McGraw Hill