a. Compute the equation of the least-squares line. b. What is the value of r? c. Does the linear relationship between perceived stress and telomere length account for a large or small proportion of the variability in telomere length? Justify your answer.
a. Compute the equation of the least-squares line. b. What is the value of r? c. Does the linear relationship between perceived stress and telomere length account for a large or small proportion of the variability in telomere length? Justify your answer.

Glencoe Algebra 1, Student Edition, 9780079039897, 0079039898, 2018
18th Edition
ISBN:9780079039897
Author:Carter
Publisher:Carter
Chapter10: Statistics
Section10.1: Measures Of Center
Problem 9PPS

Related questions
Question
100%
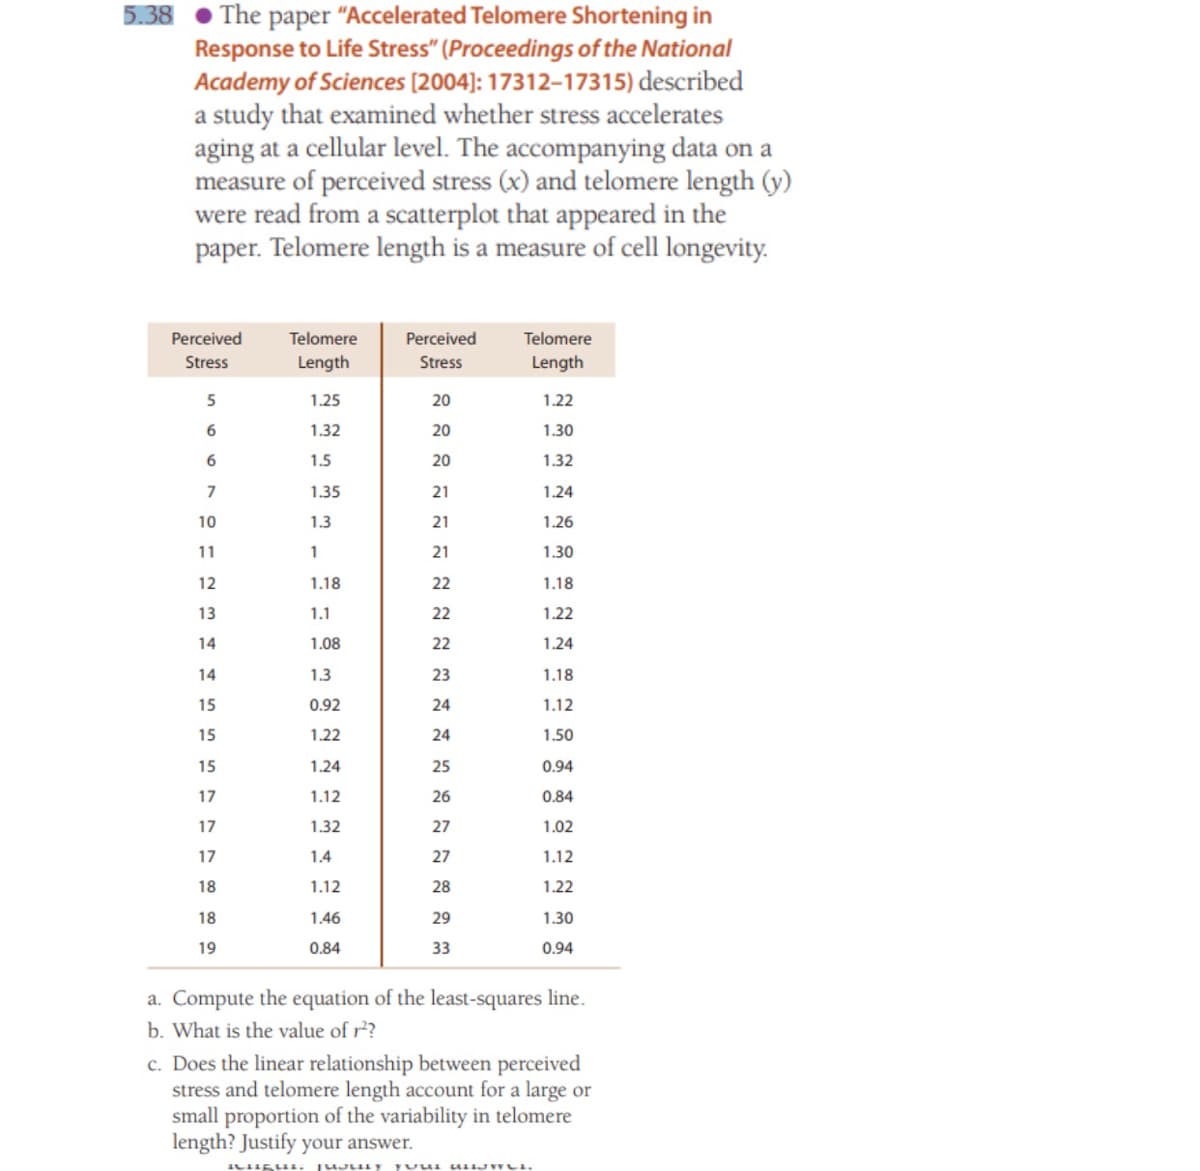
Transcribed Image Text:The paper "Accelerated Telomere Shortening in
Response to Life Stress" (Proceedings of the National
Academy of Sciences (2004): 17312-17315) described
a study that examined whether stress accelerates
aging at a cellular level. The accompanying data on a
measure of perceived stress (x) and telomere length (y)
were read from a scatterplot that appeared in the
paper. Telomere length is a measure of cell longevity.
5.38
Perceived
Telomere
Perceived
Telomere
Stress
Length
Stress
Length
5
1.25
20
1.22
1.32
20
1.30
1.5
20
1.32
7
1.35
21
1.24
10
1.3
21
1.26
11
1
21
1.30
12
1.18
22
1.18
13
1.1
22
1.22
14
1.08
22
1.24
14
1.3
23
1.18
15
0.92
24
1.12
15
1.22
24
1.50
15
1.24
25
0.94
17
1.12
26
0.84
17
1.32
27
1.02
17
1.4
27
1.12
18
1.12
28
1.22
18
1.46
29
1.30
19
0.84
33
0.94
a. Compute the equation of the least-squares line.
b. What is the value of r?
c. Does the linear relationship between perceived
stress and telomere length account for a large or
small proportion of the variability in telomere
length? Justify your answer.
Expert Solution
This question has been solved!
Explore an expertly crafted, step-by-step solution for a thorough understanding of key concepts.

This is a popular solution!

Trending now
This is a popular solution!

Step by step
Solved in 3 steps with 1 images

Follow-up Questions
Read through expert solutions to related follow-up questions below.
Follow-up Question
What is the standard deviation around the least-squares line? Why is the denominator n-2?
Solution
Recommended textbooks for you
Glencoe Algebra 1, Student Edition, 9780079039897…
Algebra
ISBN:
9780079039897
Author:
Carter
Publisher:
McGraw Hill
Glencoe Algebra 1, Student Edition, 9780079039897…
Algebra
ISBN:
9780079039897
Author:
Carter
Publisher:
McGraw Hill