a. Construct a scatterplot of the data. b. Find the equation of the least-squares line. c. Do you think the least-squares line gives accurate predictions? Explain. d. Delete the observation with the largest x value from the data set and recalculate the equation of the least-squares line. Does this observation greatly affect the equation of the line?
a. Construct a scatterplot of the data. b. Find the equation of the least-squares line. c. Do you think the least-squares line gives accurate predictions? Explain. d. Delete the observation with the largest x value from the data set and recalculate the equation of the least-squares line. Does this observation greatly affect the equation of the line?

Glencoe Algebra 1, Student Edition, 9780079039897, 0079039898, 2018
18th Edition
ISBN:9780079039897
Author:Carter
Publisher:Carter
Chapter10: Statistics
Section10.3: Measures Of Spread
Problem 1GP

Related questions
Question
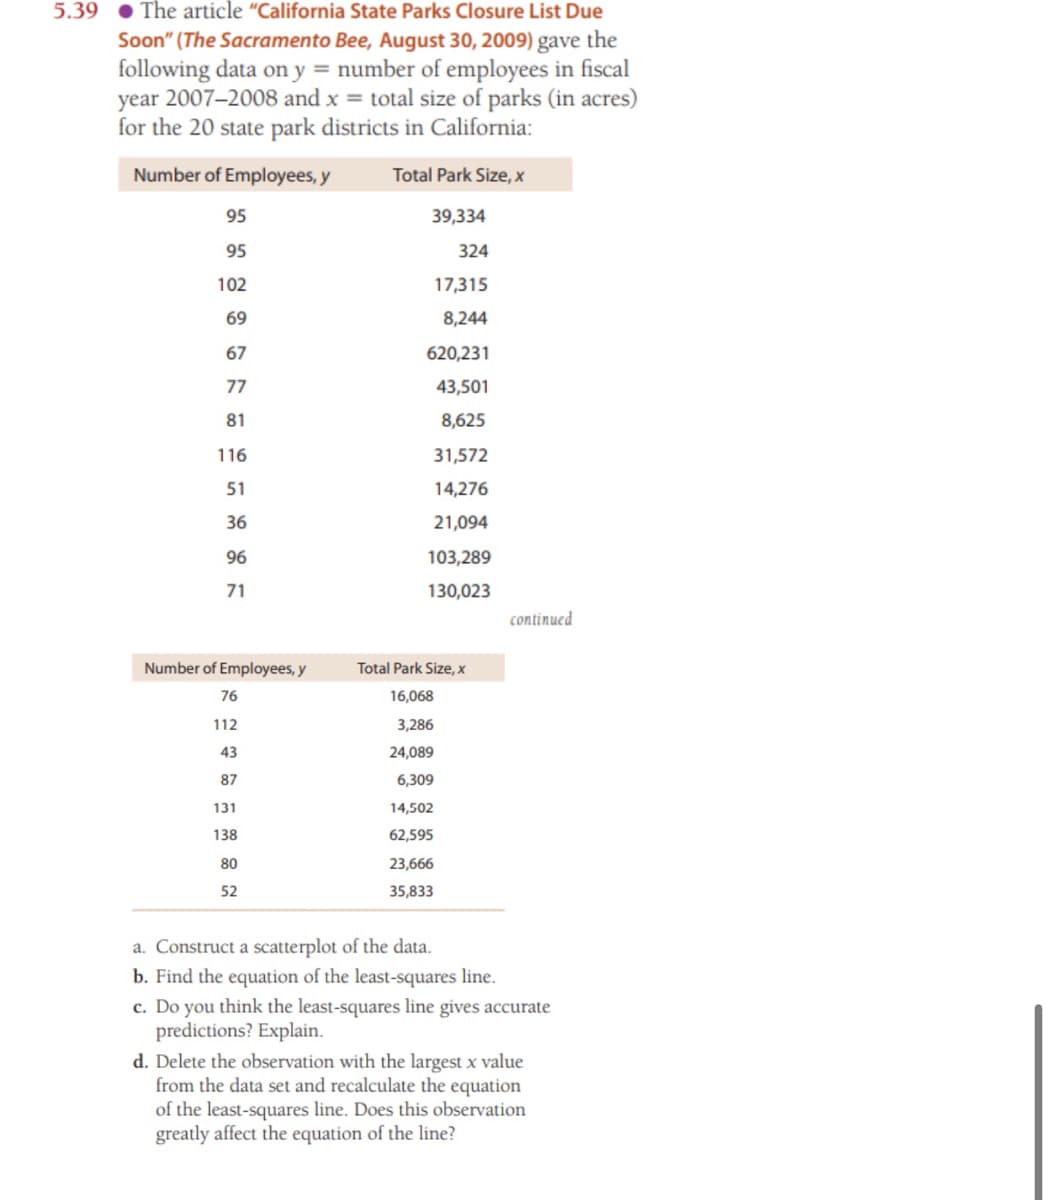
Transcribed Image Text:5.39 • The article "California State Parks Closure List Due
Soon" (The Sacramento Bee, August 30, 2009) gave the
following data on y = number of employees in fiscal
year 2007–2008 and x = total size of parks (in acres)
for the 20 state park districts in California:
Number of Employees, y
Total Park Size, x
95
39,334
95
324
102
17,315
69
8,244
67
620,231
77
43,501
81
8,625
116
31,572
51
14,276
36
21,094
96
103,289
71
130,023
continued
Number of Employees, y
Total Park Size, x
76
16,068
112
3,286
43
24,089
87
6,309
131
14,502
138
62,595
80
23,666
52
35,833
a. Construct a scatterplot of the data.
b. Find the equation of the least-squares line.
c. Do you think the least-squares line gives accurate
predictions? Explain.
d. Delete the observation with the largest x value
from the data set and recalculate the equation
of the least-squares line. Does this observation
greatly affect the equation of the line?
Expert Solution
This question has been solved!
Explore an expertly crafted, step-by-step solution for a thorough understanding of key concepts.

Step by step
Solved in 2 steps with 3 images

Recommended textbooks for you
Glencoe Algebra 1, Student Edition, 9780079039897…
Algebra
ISBN:
9780079039897
Author:
Carter
Publisher:
McGraw Hill
Glencoe Algebra 1, Student Edition, 9780079039897…
Algebra
ISBN:
9780079039897
Author:
Carter
Publisher:
McGraw Hill