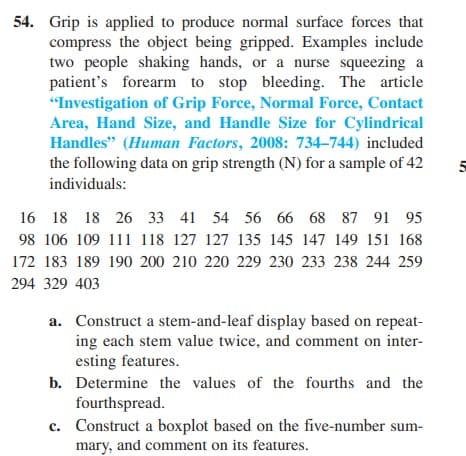
a. Construct a stem-and-leaf display based on repeat- ing each stem value twice, and comment on inter- esting features. b. Determine the values of the fourths and the fourthspread. c. Construct a boxplot based on the five-number sum- mary, and comment on its features.


Q: A university examines the variability in the math scores of students accepted to the business and…
A: Hello! As you have posted 2 different questions, we are answering the first question. In case you…
Q: Use your graphing utility’s linear regression option to obtain a model of the form y = ax + b that…
A: Given data:
Q: Consider the following case. The government aims to evaluate the impact of for- poor-students…
A: Given that, a researcher uses the following regression specification to estimate the model:…
Q: Apperson and Fitz is a chain of clothing stores that caters to high school and college students. It…
A: Given: Hits Order 34.2 8.2 28.5 5.7 36.7 9.1 42.3 7.5 25.8 6.3 52.3 10.4 35.2 7.5…
Q: The average number of years a person takes to complete a certain graduate degree is 3. The standard…
A:
Q: There is a very strong positive association between television sets per person in a country and the…
A: A confounding variable is one that influences the variables under investigation in such a way that…
Q: 4.8 4.9 5.11 5.9 4.11 5.6 DETERMINE THEIR VARIANCE (USE 4 DECIMAL PLACES, DO NOT INCLUDE THE UNIT)…
A: Given data is5.2,5.8,5.9,6.2,4.8,4.9,5.11,5.9,4.11,5.6sample size(n)=10
Q: You are given the following information obtained from a random sample of 4 observations. 24 48 31 57…
A: a) A random sample of size 4 is drawn from a population.
Q: 4. A random variable X with a probability density function f(x) = {xe 0 (xe-x for x > 0 else a. Find…
A: Hello! As you have posted more than 3 sub parts, we are answering the first 3 sub-parts. In case…
Q: .) The probability density function of the random variable X is given by: for x > 0 otherwise. f(x)…
A:
Q: Is “how long it takes to correctly solve the puzzle” an explanatory variable or response variable?…
A: The variable that explains the expected cause, i.e., in other words, the variable that explains the…
Q: Privacy is a concern for many users of the Internet. One survey showed that 59% of Internet users…
A: Let p be the probability of concerned about the confidentiality of their email Based on this…
Q: Calculate the Mean and Median for the following. 50-100 value Frequency 10 300-350 15 350-400 10…
A: Data given CI frequency 50-100 10 100-150 30 150-200 40 200-250 70 250-300 60…
Q: Let X be N3(,) with μ = 2 (²) -3 and Σ = [1 1 1] 132 22 (a) Find the distribution of X₁ + 2X2 - 3X3.…
A:
Q: Travel Agency A travel agency tracks the monthly rain totals of a popular travel location to best…
A: M4 Accounts for 9 more inches of rain than M1 The rain total for M2 and M5 combined equals the…
Q: You may need to use the appropriate technology to answer this question. In order to determine…
A: Introduction In the given scenario, the study wanted to determine whether the driving education…
Q: Read and Understand A look at the descriptive statistics for males and Females show that male scores…
A: Given Information: Males: Mean m=2.85 Standard deviation SD=0.4 Females: Mean m=2.3 Standard…
Q: Suppose participants complete an experiment where ads are presented subliminally during a task…
A: Given info: Suppose participants complete an experiment where ads are presented subliminally during…
Q: Time left 0:24:11 The item refers to the Table below which shows the scores obtained by ten students…
A: Given: n = 10 Formula Used: Correlation coefficient r = n∑XY-∑X∑Yn∑X2-∑X2n∑Y2-∑Y2
Q: In an AOL survey of Internet users, this question was posted online: "Have you ever been hit by a…
A: Given: The question posted online is: Have you ever been hit by a computer virus? Among the…
Q: In a study of handedness in occupations, 10 out of 118 psychiatrists were left-handed, 26 out of 148…
A: Given,10 out of 118 psychiatrists were left-handed26 out of 148 architects were left-handed5 out of…
Q: What is the mode in the graph below? 600- 500- 400- 300 200- Frequency
A: Given data,here frequency distribution graph is given .we have find out the mode of the graph here…
Q: Identify the kind of sample that is described. A salary committee for a Midwestern college sends an…
A: Given: A salary committee for a Midwestern college sends an email to all employees asking them to…
Q: Intelligence as measured by IQ score = 136 is best described as O Nominal Ordinal O Interval O Ratio
A: Nominal scale: The data values represent categories that merely qualitatively differ from one…
Q: The human resource department at a certain company wants to conduct a survey regarding worker…
A: a) In this case, the department has an alphabetical list of all 3207 employees at the company and it…
Q: Walmarts 2016 sales were about $481 billion. Suppose sales are projected to increase at a rate of…
A:
Q: (6) A student surveys some students on campus in the evening and finds that 16 out of 20 of the…
A: Since you have posted more than one question Incan answer only first question at this time. Please…
Q: A random sample of 15 college students were asked "How many hours per week typically do you work…
A: we will form the frequency table of the given data after arranging them into ascending order
Q: Twelve different video games showing violence were observed he duration times of violence were…
A: Given that Twelve different video games showing violence were observed he duration times of violence…
Q: 6. The diameter of electric cables, say X, is assumed to be a continuous random variable with…
A:
Q: Tara McCoy is the office administrator for the Departmentof Management at State University. The…
A: Given The data is as follows: Average lead time, L¯=2 Standard deviation of lead time, σLT=0.5…
Q: Use the side-by-side boxplots shown to complete parts (a) through (e). Two stacked horizontal…
A: Hint: Box plot tell us about various features of data such as outliers, quartiles, median, kurtosis,…
Q: (A) Median and mode have no use as a measure of central tendency. (B) The mean with a standard…
A: Measure of central tendency are used to measure the average and center value of the data set.…
Q: (A) Ratio-levels of measurement is defined by the presence of a true zero. (B) Thus, it is improper…
A: The ratio level of measurement is quantitative in nature. It orders the data and has an equally…
Q: The California State University (CSU) system consists of 23 campuses, from San Diego State in the…
A: Given Information: From San Diego State in the south to Humboldt State close to the Oregon border,…
Q: Given the information below, which of the following is WITHOUT DOUBT, absolutely true. Legend: m =…
A: From the given curve, it is clear that the data set is positively skewed as the mean is in the right…
Q: Karl and Leonard want to make soup. In order to get the right balance of ingredients for their…
A: Given: 3 pounds potatoes at $3.58 per pound 5 pounds cod at $4.71 per pound 2 pounds fish broth at…
Q: A simple random sample of 60 items from a population with a = 6 resulted in a sample mean of 38.…
A: Given Information: Sample size n=60 Population standard deviation σ=6 Sample mean x¯=38
Q: b. On a measure of social anxiety people scored: 35, 40, 45, 40, 40, 35, 45, 50, 50, 60, 60, 70, 70,…
A: Hint: Quantitative data is data that contains numeric values.
Q: Assume that the ages for first marriages are normally distributed with a mean of 26 years and a…
A:
Q: An independent consumer group states that, among all people with depression who use a new…
A: The claim is that the proportion of people who find relief from depression is 0.65. Given: Sample…
Q: Professor Chauvet wants to know how quickly her students can type out a text message. So that…
A: The objective is to identify which of the given choices is best measure to describe the center of…
Q: (A) Variance relates to how the values in the data set are positioned relative to each other. (B) A…
A: Variance is one of the measures of dispersion or spread.
Q: 5. Four car rental prices were quoted for a 3-day rental. The frequencies are listed. Let x…
A: The objective is to find the missing values in the table. Given data indicates the car rental prices…
Q: A defunct website listed the "average" annual income for Florida as $35,031. What is the role of…
A: Descriptive Statistics: The assessment, summation, and findings of the research pertaining to…
Q: Q1: Mention the required steps to get the following: a) Finding the percentile ranks of student…
A: Percentile Histogram Skewness Kurtosis Quartile Box plot Normal Distribution
Q: give the boundaries of the indicated value 3
A: Formula: Lower Bound=Value-0.5 Upper Bound=Value+0.5 Given value is 3.8 pounds.
Q: (6) A student surveys some students on campus in the evening and finds that 16 out of 20 of the…
A: A bias in the survey may be defined as the intentional or unintentional tendency to over or…
Q: The following results come from two independent random samples taken of two populations. Sample 1 n₁…
A: a) Two independent random samples are taken from two populations.
Q: The body temperatures of a group of healthy adults have a bell-shaped distribution with a mean of…
A: Given that Mean = M = 98.16 Standard deviation = SD = 0.65 X ~ Normal ( M = 98.16 , SD = 0.65 )


Trending now
This is a popular solution!

Step by step
Solved in 4 steps with 2 images

- When determining whether grounding accidents and hull failures result in different spillage (is there a difference between spills caused by grounding or hull failures) would I use a two tail t test to decide this?An entomologist believes that the median body length of lady beetles is 15.0 millimeters. A random sample of 16 lady beetles were measured and recorded as in the table below. 14.5 15.2 15.2 15.4 15.4 15.0 14.9 14.6 15.0 15.1 15.1 14.8 15.6 15.1 15.4 15.5 At α = 0.05, test the claim that the lady beetles’ body length is different from theestimated length.The anterior cruciate ligament (ACL) runs diagonally in the middle of the knee. The article “Return to Sport After Pediatric Anterior Cruciate Ligament Reconstruction and Its Effect on Subsequent Anterior Cruciate Ligament Injury” (T. Dekker, J. Godin, et al., Journal of Bone and Joint Surgery, 2017:897–904) reported results for 85 young athletes who suffered anterior cruciate ligament (ACL) injuries. Of the 85 injuries, 51 were to the left knee and 34 were to the right knee. Can you conclude that more than half of ACL injuries are to the left knee?
- In a random sample of 765 adults in the United States, 122 of them said if they had to cover a $400 emergency expense, they would need to use a credit card and pay it back over time. a. what is the parameter being estimated b. what is the sample proportion (must show work)Evans conducted a study to determine if the frequency and characteristics of pediatric problems in elderly patients with diabetes present differences with respect to patients of the same age, but without diabetes. The individuals studied, interned in a clinic, were between 70 and 90 years old. Among the researchers' findings are the following statistics. with respect to the scores on the deep tendon reflexes meters:Sample without Diabetes: 79 / 2.1 / 1.1With Diabetes: 74 / 1.6 / 1.2Is it possible to conclude, based on the data, that, on average, diabetic patients they have reduced deep tendon reflexes in comparison with patients without diabetes of the same age?The article “Structural Performance of Rounded Dovetail Connections Under Different Loading Conditions” (T. Tannert, H. Prion, and F. Lam, Can J Civ Eng, 2007:1600–1605) describes a study of the deformation properties of dovetail joints. In one experiment, 10 rounded dovetail connections and 10 double rounded dovetail connections were loaded until failure. The rounded connections had an average load at failure of 8.27 kN with a standard deviation of 0.62 kN. The double-rounded connections had an average load at failure of 6.11 kN with a standard deviation of 1.31 kN. Can you conclude that the mean load at failure is greater for rounded connections than for double-rounded connections?
- Lactation promotes a temporary loss of bone mass to provide adequate amounts of calcium for milk production. The paper “Bone Mass Is Recovered from Lactation to Postweaning in Adolescent Mothers with Low Calcium Intakes” (Amer. J. of Clinical Nutr., 2004: 1322–1326) gave the following data on total body bone mineral content (TBBMC) (g) for a sample both during lactation (L) and in the postweaning period (P). SubjectL 1928 2549 2825 1924 1628 2175 2114 2621 1843 2541P 2126 2885 2895 1942 1750 2184 2164 2626 2006 2627 Does the data suggest that true average total body bone mineral content during postweaning exceeds that during lactation by more than 25 g? State and test the appropriate hypotheses using a significance level of .05.Suppose a study reported that the average persin watched 3.37 hours of television per day. a random sample of 15 people gave the number of hours of television watched per day shown below. at the 1% significance level, do the data provide sufficent evidence to conclude that the amount of television watched per day last year by the average person is greater than the value reported in the study? A.select the correct parameter. a.the average number of hours that all people watch tv b. the average number of hours that the 15 people watch tv c. the fraction of hours people watch tv d. the total number of hours that a person watches tv B. select the correct hypotheses: a. Ho: mu= 3.37 Ha: mu is greater than 3.37 b. Ho: mu=4.103 Ha: mu is greater than 4.103 c.Ho: p=3.37 Ha: p is less than 3.37 d.Ho: mu=3.37 Ha: mu is less than 3.37 C. which of following statements best describes the sampling distribution? a. the sampling distribution is normal with mean 3.37 hours and standard deviation…According to recent UN figures, the annual gun homicide rate is 62.4 per one mil- lion residents in the US and 1.3 per one million residents in Britain. Compare the proportion of residents killed annually by guns using the (a) difference of propor- tions, (b) relative risk. Which measure is more useful for describing the strength of association? Why?
- Data on pull-off force (pounds) for connectors used in an automobile engine application are asfollows:79.3, 75.1, 78.2, 74.1, 73.9, 75.0, 77.6, 77.3, 73.8, 74.6, 75.5, 74.0, 74.7, 75.9, 72.9, 73.8, 74.2, 78.1,75.4, 76.3, 75.3, 76.2, 74.9, 78.0, 75.1, 76.8.a) Check the assumption that pull-off force is normally distributed. Include a graphical display in youranswer.b) Calculate a point estimate of the mean pull-off force of all connectors in the population. State whichestimator you used and why.c) Calculate a point estimate of the pull-off force value that separates the weakest 50% of the connectorsin the population from the strongest 50%.A study of college students in the city of Pemblington found that 8% had been victims of violent crimes. a) statistics b) parameterAn article reports the following values for soil heat flux of eight plots covered with coal dust. 37.9 37.8 37.9 35.1 35.5 27.5 18.3 24.1 The mean soil heat flux for plots covered only with grass is 29.0. Assuming that the heat-flux distribution is approximately normal, does the data suggest that the coal dust is effective in increasing the mean heat flux over that for grass? Test the appropriate hypotheses using ? = 0.05.State the appropriate hypotheses. H0: ? = 29Ha: ? > 29H0: ? = 29Ha: ? < 29 H0: ? = 29Ha: ? ≠ 29H0: ? ≠ 29Ha: ? = 29 Calculate the test statistic and determine the P-value. (Round your test statistic to two decimal places and your P-value to three decimal places.) t = P-value = State the conclusion in the problem context. Reject the null hypothesis. There is sufficient evidence to conclude that there was an increase in mean heat flux.Do not reject the null hypothesis. There is sufficient evidence to conclude that…