A. Enter Ages of Actresses into L1 and Age of Actors in L2. B. Run 1-VarStats(L1) to find the following descriptive statistic for the actresses. Details about using 1-VarStats given in Chapter 12 notes & lecture video. C. Use the calculator output to fill in the table on the next page. D. Then run 1-VarStats(L2) to find the following descriptive statistic for the actors. E. Use the calculator output to fill in the table on the next page.
A. Enter Ages of Actresses into L1 and Age of Actors in L2. B. Run 1-VarStats(L1) to find the following descriptive statistic for the actresses. Details about using 1-VarStats given in Chapter 12 notes & lecture video. C. Use the calculator output to fill in the table on the next page. D. Then run 1-VarStats(L2) to find the following descriptive statistic for the actors. E. Use the calculator output to fill in the table on the next page.

Holt Mcdougal Larson Pre-algebra: Student Edition 2012
1st Edition
ISBN:9780547587776
Author:HOLT MCDOUGAL
Publisher:HOLT MCDOUGAL
Chapter7: Percents
Section7.4: The Percent Equation
Problem 28E

Related questions
Question
The first page goes hand and hand with the second page please help
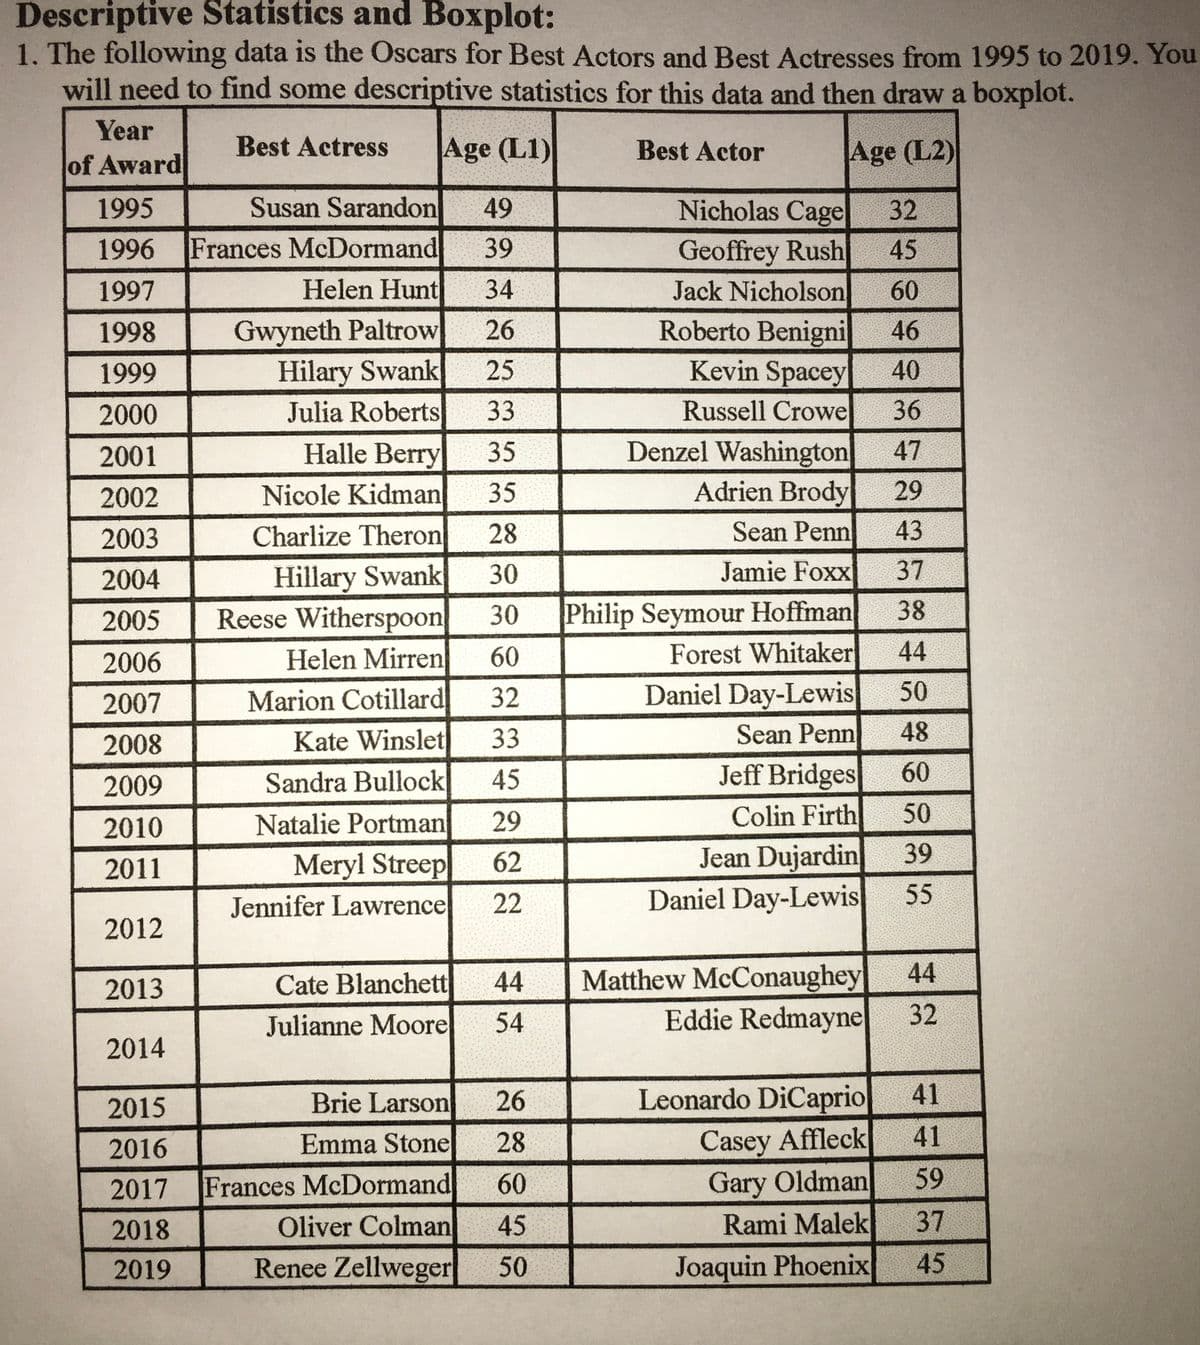
Transcribed Image Text:Descriptive Statistics and Boxplot:
1. The following data is the Oscars for Best Actors and Best Actresses from 1995 to 2019. You
will need to find some descriptive statistics for this data and then draw a boxplot.
Year
of Award
Best Actress
Age (L1)
Best Actor
Age (L2)
1995
Susan Sarandon
49
Nicholas Cage
32
Frances McDormand
39
Geoffrey Rush
Jack Nicholson
Roberto Benigni
Kevin Spacey
1996
45
1997
Helen Hunt
34
60
Gwyneth Paltrow
Hilary Swank
Julia Roberts
Halle Berry
1998
26
46
1999
25
40
2000
33
Russell Crowe
36
Denzel Washington
Adrien Brody
2001
35
47
Nicole Kidman
Charlize Theron
2002
35
29
2003
28
Sean Penn
43
Jamie Foxx
37
Hillary Swank
Reese Witherspoon
2004
30
Philip Seymour Hoffman
Forest Whitaker
Daniel Day-Lewis
2005
30
38
2006
Helen Mirren
60
44
50
Marion Cotillard
Kate Winslet
2007
32
2008
33
Sean Penn
48
Jeff Bridges
Colin Firth
60
Sandra Bullock
Natalie Portman
2009
45
29
50
2010
Jean Dujardin
Daniel Day-Lewis
39
Meryl Streep
Jennifer Lawrence
2011
62
22
55
2012
44
Cate Blanchett
Julianne Moore
Matthew McConaughey
Eddie Redmayne
2013
44
54
32
2014
Leonardo DiCaprio
41
Brie Larson
Emma Stone
2015
26
Casey Affleck
Gary Oldman
Rami Malek
2016
28
41
2017 Frances McDormand
60
59
2018
Oliver Colman
45
37
2019
Renee Zellweger
50
Joaquin Phoenix
45
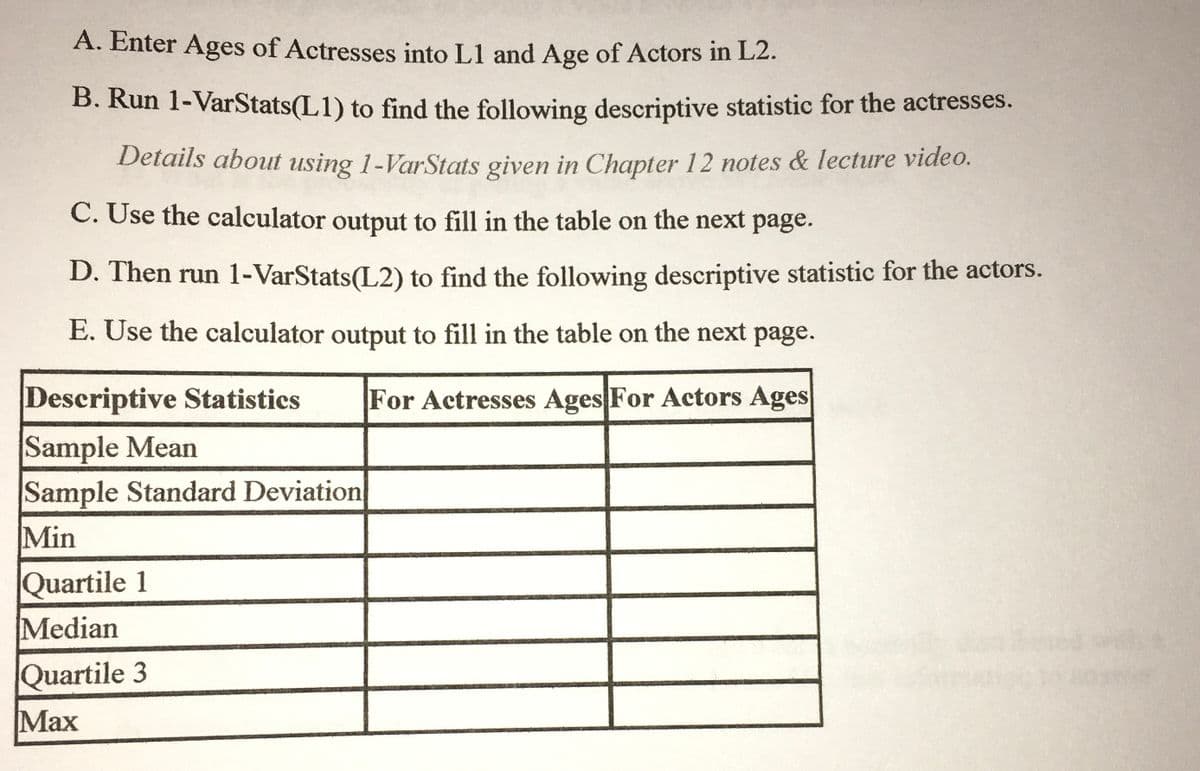
Transcribed Image Text:A. Enter Ages of Actresses into L1 and Age of Actors in L2.
B. Run 1-VarStats(L1) to find the following descriptive statistic for the actresses.
Details about using 1-VarStats given in Chapter 12 notes & lecture video.
C. Use the calculator output to fill in the table on the next page.
D. Then run 1-VarStats(L2) to find the following descriptive statistic for the actors.
E. Use the calculator output to fill in the table on the next page.
Descriptive Statistics
For Actresses Ages For Actors Ages
Sample Mean
Sample Standard Deviation
Min
Quartile 1
Median
Quartile 3
Max
Expert Solution
This question has been solved!
Explore an expertly crafted, step-by-step solution for a thorough understanding of key concepts.

This is a popular solution!

Trending now
This is a popular solution!

Step by step
Solved in 2 steps with 5 images

Knowledge Booster


Learn more about
Need a deep-dive on the concept behind this application? Look no further. Learn more about this topic, statistics and related others by exploring similar questions and additional content below.Recommended textbooks for you
Holt Mcdougal Larson Pre-algebra: Student Edition…
Algebra
ISBN:
9780547587776
Author:
HOLT MCDOUGAL
Publisher:
HOLT MCDOUGAL

Glencoe Algebra 1, Student Edition, 9780079039897…
Algebra
ISBN:
9780079039897
Author:
Carter
Publisher:
McGraw Hill
Holt Mcdougal Larson Pre-algebra: Student Edition…
Algebra
ISBN:
9780547587776
Author:
HOLT MCDOUGAL
Publisher:
HOLT MCDOUGAL
Glencoe Algebra 1, Student Edition, 9780079039897…
Algebra
ISBN:
9780079039897
Author:
Carter
Publisher:
McGraw Hill