a.) Find the linear formula for price per Blivet as a function of quantity g. p= b.) Write out the formula for your total revenue for an order of q Blivets. TR(q)= c.) Recall that marginal revenue at q is given by MR(g)=R+1)=TR4) and compute the marginal revenue for selling 10 Blivets. dollars per Blivet d.) The Blivets cost $5 each to manufacture and you have fixed costs of $100. Give the formula for the total cost to produce q Blivets. TC(q)= e.) What is the maximum profit? Include units. (Assume that you cannot sell a fraction of a Blivet. The quantity that maximizes profit must be a whole number.)
a.) Find the linear formula for price per Blivet as a function of quantity g. p= b.) Write out the formula for your total revenue for an order of q Blivets. TR(q)= c.) Recall that marginal revenue at q is given by MR(g)=R+1)=TR4) and compute the marginal revenue for selling 10 Blivets. dollars per Blivet d.) The Blivets cost $5 each to manufacture and you have fixed costs of $100. Give the formula for the total cost to produce q Blivets. TC(q)= e.) What is the maximum profit? Include units. (Assume that you cannot sell a fraction of a Blivet. The quantity that maximizes profit must be a whole number.)

Functions and Change: A Modeling Approach to College Algebra (MindTap Course List)
6th Edition
ISBN:9781337111348
Author:Bruce Crauder, Benny Evans, Alan Noell
Publisher:Bruce Crauder, Benny Evans, Alan Noell
Chapter3: Straight Lines And Linear Functions
Section3.3: Modeling Data With Linear Functions
Problem 7E: Tuition at American Public Universities This is a continuation of Exercise 6. The following table...

Related questions
Question
(section 2. 2) This is another question from my math homework due at 5, and I have attached my equation "cheat-sheet" please help me!
Transcribed Image Text:31
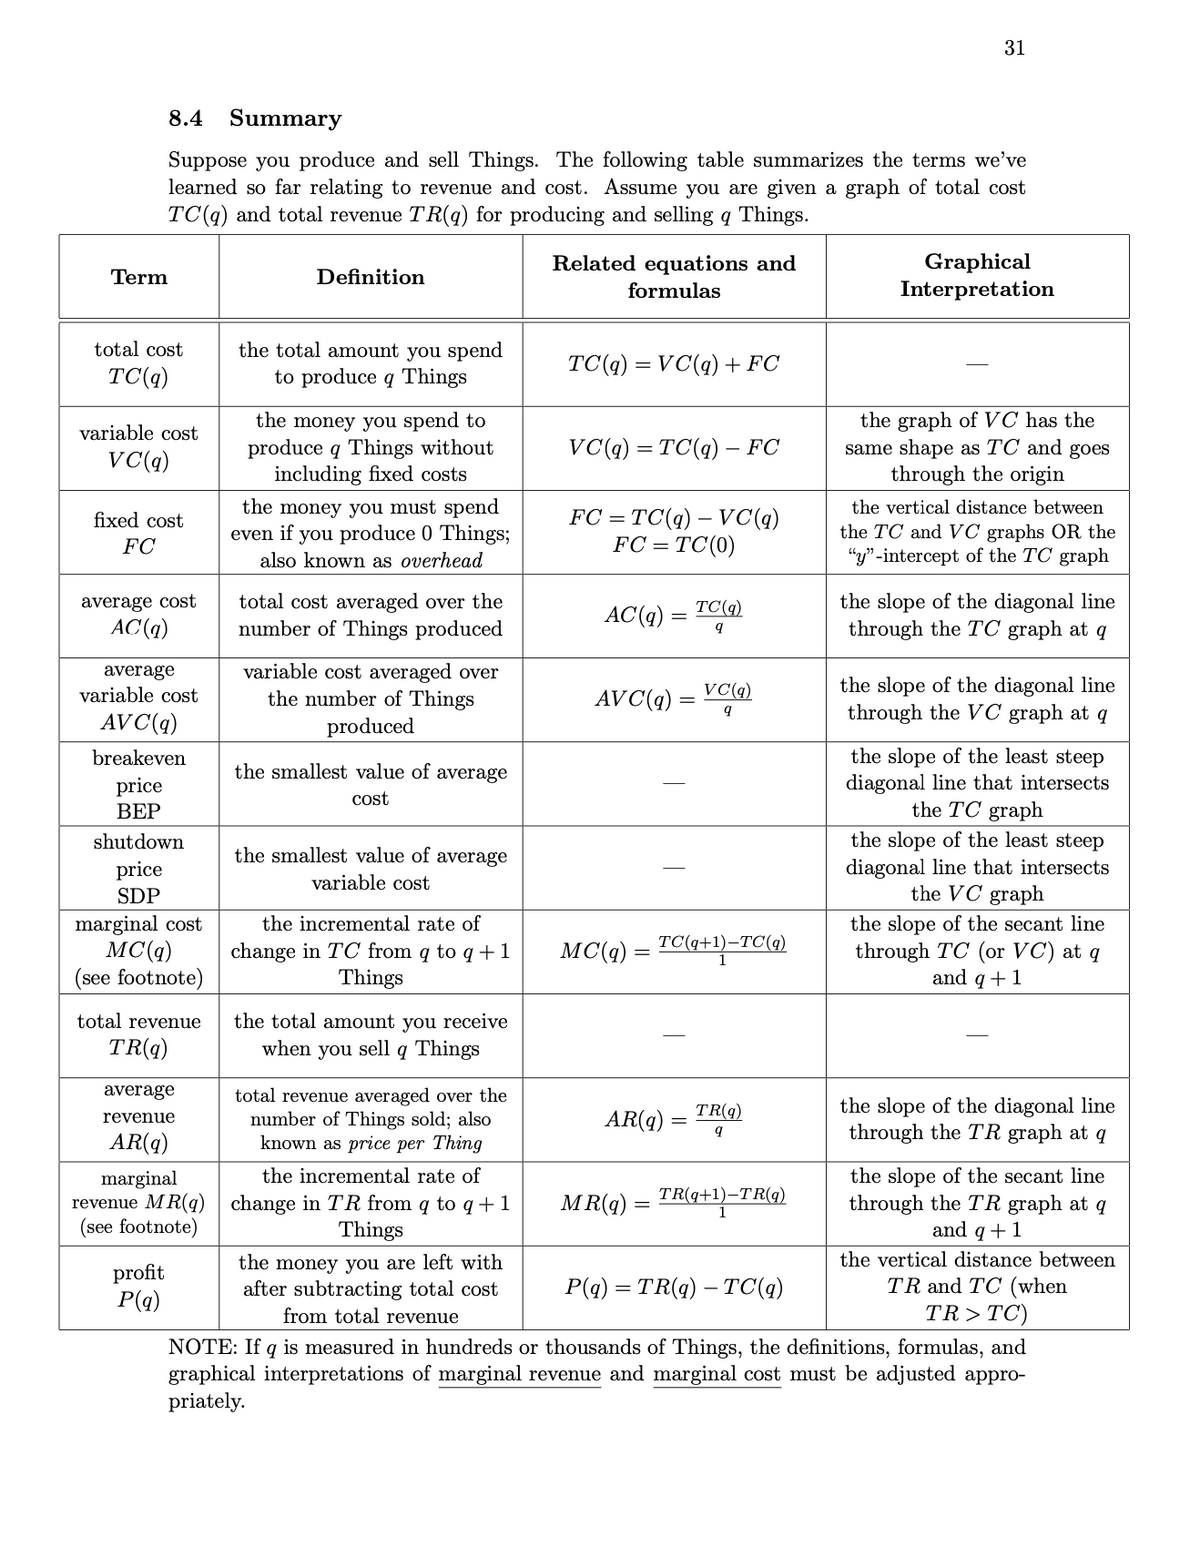
8.4 Summary
Suppose you produce and sell Things. The following table summarizes the terms we've
learned so far relating to revenue and cost. Assume you are given a graph of total cost
TC(q) and total revenue TR(q) for producing and selling q Things.
Graphical
Interpretation
Related equations and
Term
Definition
formulas
the total amount you spend
to produce q Things
total cost
TC(q) = V C(q)+ FC
TC(q)
the money you spend to
produce q Things without
including fixed costs
the graph of VC has the
same shape as TC and goes
through the origin
variable cost
VC(q) = TC(q) – FC
VC(q)
the money you must spend
even if you produce 0 Things;
the vertical distance between
FC = TC(q) – VC(q)
FC = TC(0)
fixed cost
the TC and VC graphs OR the
"y"-intercept of the TC graph
FC
also known as overhead
average cost
AC(q)
total cost averaged over the
number of Things produced
the slope of the diagonal line
through the TC graph at q
TC(q)
AC(q)
average
variable cost
variable cost averaged over
the number of Things
produced
the slope of the diagonal line
through the VC graph at q
VC(q)
AVC(q)
AV C(q)
the slope of the least steep
diagonal line that intersects
the TC graph
the slope of the least steep
diagonal line that intersects
the VC graph
the slope of the secant line
through TC (or VC) at q
and q+1
breakeven
the smallest value of average
price
ВЕР
cost
shutdown
the smallest value of average
price
variable cost
SDP
marginal cost
MC(q)
(see footnote)
the incremental rate of
(q+1)—ТC(q)
MC(q)
change in TC from q to q+ 1
Things
total revenue
the total amount you receive
when you sell q Things
TR(q)
average
total revenue averaged over the
number of Things sold; also
known as price per Thing
the slope of the diagonal line
through the TR graph at q
TR(q)
AR(q)
revenue
AR(q)
the slope of the secant line
through the TR graph at q
and q+1
the incremental rate of
marginal
revenue MR(q) | change in TR from q to q +1
(see footnote)
MR(q)
TR(q+1)–TR(g)
Things
the vertical distance between
profit
P(q)
the money you are left with
after subtracting total cost
from total revenue
TR and TC (when
TR>TC)
P(q) = TR(q) – TC(q)
NOTE: If q is measured in hundreds or thousands of Things, the definitions, formulas, and
graphical interpretations of marginal revenue and marginal cost must be adjusted appro-
priately.
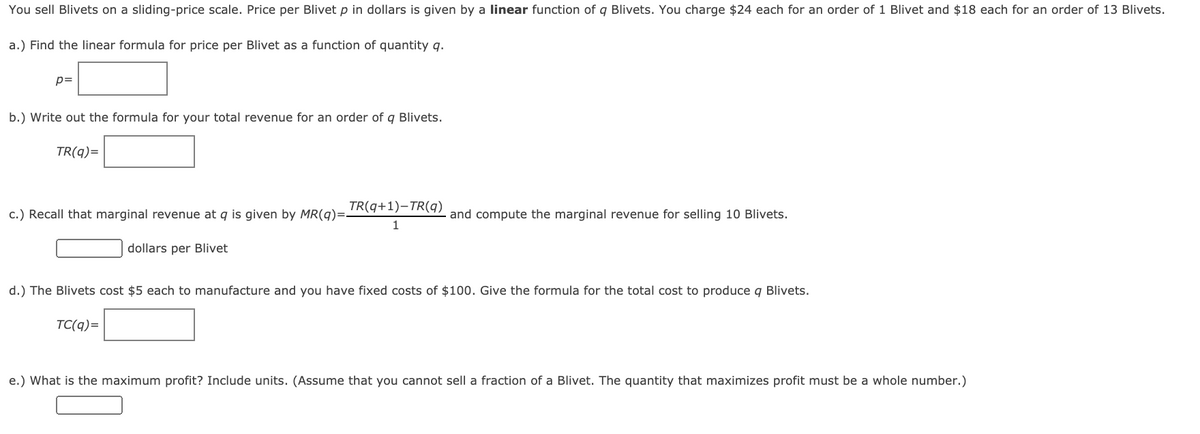
Transcribed Image Text:You sell Blivets on a sliding-price scale. Price per Blivet p in dollars is given by a linear function of q Blivets. You charge $24 each for an order of 1 Blivet and $18 each for an order of 13 Blivets.
a.) Find the linear formula for price per Blivet as a function of quantity q.
p=
b.) Write out the formula for your total revenue for an order of q Blivets.
TR(q)=
TR(q+1)-TR(q)
c.) Recall that marginal revenue at q is given by MR(q)=-
and compute the marginal revenue for selling 10 Blivets.
dollars per Blivet
d.) The Blivets cost $5 each to manufacture and you have fixed costs of $100. Give the formula for the total cost to produce q Blivets.
TC(q)=
e.) What is the maximum profit? Include units. (Assume that you cannot sell a fraction of a Blivet. The quantity that maximizes profit must be a whole number.)
Expert Solution
part a
By bartleby rules only first three subparts have been answered
Given that is the price per blivet and number of blivets to sell is
Price for an order of 1 blivet is $24 and that for an order of 13 blivets is $18.
Since is a function of , therefore,
So, the line passes through the points (1,24) and (13,18).
Slope of the line is
Therefore, equation of the line is
Hence, can be expressed as

Trending now
This is a popular solution!

Step by step
Solved in 3 steps

Knowledge Booster


Learn more about
Need a deep-dive on the concept behind this application? Look no further. Learn more about this topic, advanced-math and related others by exploring similar questions and additional content below.Recommended textbooks for you
Functions and Change: A Modeling Approach to Coll…
Algebra
ISBN:
9781337111348
Author:
Bruce Crauder, Benny Evans, Alan Noell
Publisher:
Cengage Learning

Algebra & Trigonometry with Analytic Geometry
Algebra
ISBN:
9781133382119
Author:
Swokowski
Publisher:
Cengage

Algebra and Trigonometry (MindTap Course List)
Algebra
ISBN:
9781305071742
Author:
James Stewart, Lothar Redlin, Saleem Watson
Publisher:
Cengage Learning
Functions and Change: A Modeling Approach to Coll…
Algebra
ISBN:
9781337111348
Author:
Bruce Crauder, Benny Evans, Alan Noell
Publisher:
Cengage Learning
Algebra & Trigonometry with Analytic Geometry
Algebra
ISBN:
9781133382119
Author:
Swokowski
Publisher:
Cengage
Algebra and Trigonometry (MindTap Course List)
Algebra
ISBN:
9781305071742
Author:
James Stewart, Lothar Redlin, Saleem Watson
Publisher:
Cengage Learning


Algebra for College Students
Algebra
ISBN:
9781285195780
Author:
Jerome E. Kaufmann, Karen L. Schwitters
Publisher:
Cengage Learning

Holt Mcdougal Larson Pre-algebra: Student Edition…
Algebra
ISBN:
9780547587776
Author:
HOLT MCDOUGAL
Publisher:
HOLT MCDOUGAL