A. For the circuit shown in Figure 1 your manager asked you to apply the circuit theorems to calculate the voltages and currents in Table 4 using Ohm's Law, Current divider and volta divider. В R1 3KQ R2 R4 1.5kQ 1kQ Vs =15 V 2 R3 2kQ R5 1.5kQ' Figure 1 Table 4 Required Value VRI Calculated Value IRI Ir2 IR3 IR4 IRs VR2 VR3 VR4 VR5
A. For the circuit shown in Figure 1 your manager asked you to apply the circuit theorems to calculate the voltages and currents in Table 4 using Ohm's Law, Current divider and volta divider. В R1 3KQ R2 R4 1.5kQ 1kQ Vs =15 V 2 R3 2kQ R5 1.5kQ' Figure 1 Table 4 Required Value VRI Calculated Value IRI Ir2 IR3 IR4 IRs VR2 VR3 VR4 VR5

Delmar's Standard Textbook Of Electricity
7th Edition
ISBN:9781337900348
Author:Stephen L. Herman
Publisher:Stephen L. Herman
Chapter18: Resistive-inductive Parallel Circuits
Section: Chapter Questions
Problem 12PP: In an R-L parallel circuit, ET=480 volts, R=16, and XL=24. Find PF.

Related questions

Question
Part A, B, C
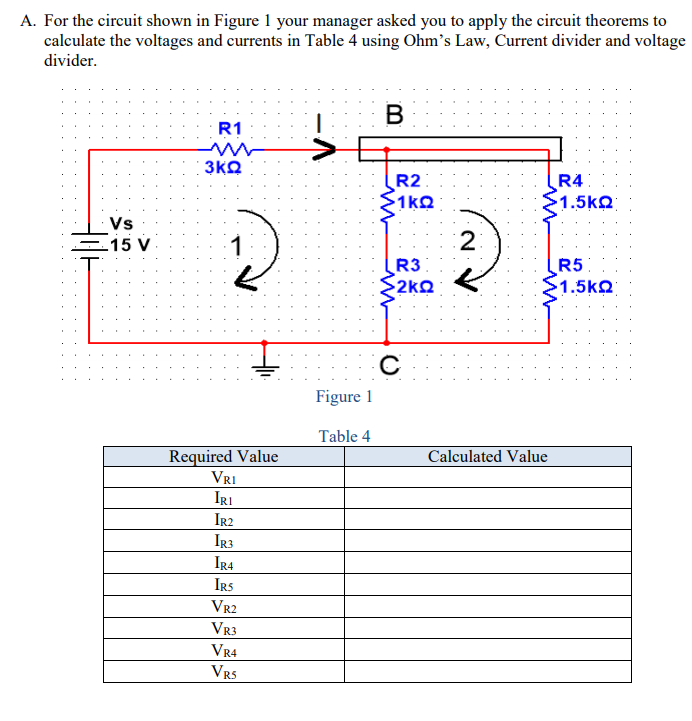
Transcribed Image Text:A. For the circuit shown in Figure 1 your manager asked you to apply the circuit theorems to
calculate the voltages and currents in Table 4 using Ohm's Law, Current divider and voltage
divider.
R1
3KQ
R2
1kQ
R4
1.5kQ
Vs
-15 V
2
R3
R5
2kQ
1.5kQ
Figure 1
Table 4
Required Value
VRI
Calculated Value
IRI
Ir2
IR3
IR4
IRS
VR2
VR3
VR4
VR5
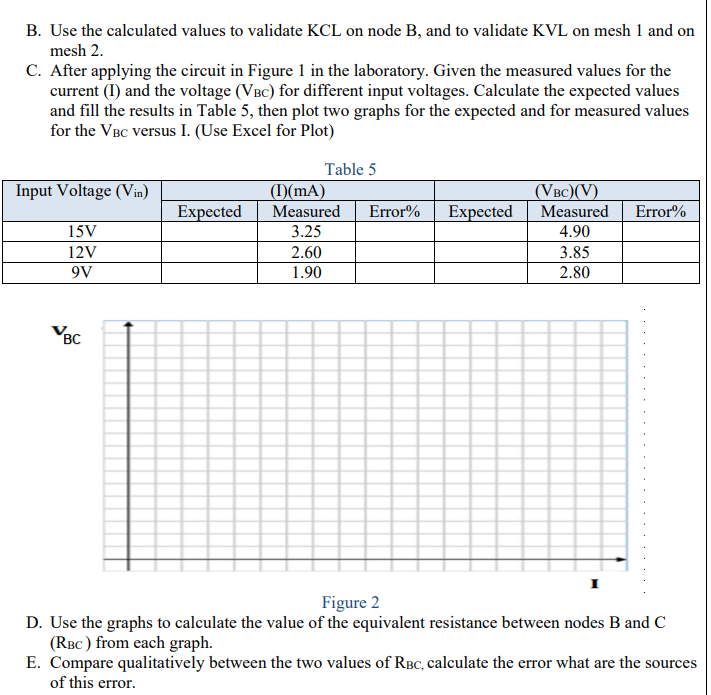
Transcribed Image Text:B. Use the calculated values to validate KCL on node B, and to validate KVL on mesh 1 and on
mesh 2.
C. After applying the circuit in Figure 1 in the laboratory. Given the measured values for the
current (I) and the voltage (VBC) for different input voltages. Calculate the expected values
and fill the results in Table 5, then plot two graphs for the expected and for measured values
for the VBC versus I. (Use Excel for Plot)
Table 5
Input Voltage (Vin)
()(mA)
Measured
(VBC)(V)
Expected
Error%
Expected
Measured
Error%
15V
4.90
12V
2.60
3.85
9V
1.90
2.80
BC
Figure 2
D. Use the graphs to calculate the value of the equivalent resistance between nodes B and C
(RBc ) from each graph.
E. Compare qualitatively between the two values of RBC, calculate the error what are the sources
of this error.
Expert Solution
This question has been solved!
Explore an expertly crafted, step-by-step solution for a thorough understanding of key concepts.

This is a popular solution!

Trending now
This is a popular solution!

Step by step
Solved in 3 steps with 3 images

Knowledge Booster


Learn more about
Need a deep-dive on the concept behind this application? Look no further. Learn more about this topic, electrical-engineering and related others by exploring similar questions and additional content below.Recommended textbooks for you
Delmar's Standard Textbook Of Electricity
Electrical Engineering
ISBN:
9781337900348
Author:
Stephen L. Herman
Publisher:
Cengage Learning
Delmar's Standard Textbook Of Electricity
Electrical Engineering
ISBN:
9781337900348
Author:
Stephen L. Herman
Publisher:
Cengage Learning