a. From the first student's data, what percentage of men used turn signals, and what percentage of women used them? of men used turn signals, and of women used them. (Round to one decimal place as needed.) b. From the first student's data, assuming the conditions are met (although admittedly this was not a random selection), find a 95% confidence interval for the difference in percentages (men−women).State whether the interval captures 0, and explain whether this provides evidence that the proportions of men and women who use signals differ in the population. The 95%confidence interval for the difference in percentages (men−women) is (. %. %) (Round to one decimal place as needed.) c. From the second student's data, first find the percentage of men and the percentage of women who used turn signals, and then, assuming the conditions are met, find a 95% confidence interval for the difference in percentages. State whether the interval captures 0, and explain whether this provides evidence that the percentage of men who use turn signals differs from the percentage of women who do so. c. % of men used turn signals, and. %. of women used them. (Round to one decimal place as needed.) The 95% confidence interval for the difference (men−women) is negative %,%.
a. From the first student's data, what percentage of men used turn signals, and what percentage of women used them? of men used turn signals, and of women used them. (Round to one decimal place as needed.) b. From the first student's data, assuming the conditions are met (although admittedly this was not a random selection), find a 95% confidence interval for the difference in percentages (men−women).State whether the interval captures 0, and explain whether this provides evidence that the proportions of men and women who use signals differ in the population. The 95%confidence interval for the difference in percentages (men−women) is (. %. %) (Round to one decimal place as needed.) c. From the second student's data, first find the percentage of men and the percentage of women who used turn signals, and then, assuming the conditions are met, find a 95% confidence interval for the difference in percentages. State whether the interval captures 0, and explain whether this provides evidence that the percentage of men who use turn signals differs from the percentage of women who do so. c. % of men used turn signals, and. %. of women used them. (Round to one decimal place as needed.) The 95% confidence interval for the difference (men−women) is negative %,%.

Glencoe Algebra 1, Student Edition, 9780079039897, 0079039898, 2018
18th Edition
ISBN:9780079039897
Author:Carter
Publisher:Carter
Chapter10: Statistics
Section10.6: Summarizing Categorical Data
Problem 27PPS

Related questions
Question
a. From the first student's data, what percentage of men used turn signals, and what percentage of women used them? of men used turn signals, and of women used them.
(Round to one decimal place as needed.)
b. From the first student's data, assuming the conditions are met (although admittedly this was not a random selection), find a 95% confidence interval for the difference in percentages (men−women).State whether the interval captures 0, and explain whether this provides evidence that the proportions of men and women who use signals differ in the population.
The 95%confidence interval for the difference in percentages (men−women) is (. %. %)
(Round to one decimal place as needed.)
c. From the second student's data, first find the percentage of men and the percentage of women who used turn signals, and then, assuming the conditions are met, find a 95% confidence interval for the difference in percentages. State whether the interval captures 0, and explain whether this provides evidence that the percentage of men who use turn signals differs from the percentage of women who do so.
c. % of men used turn signals, and. %. of women used them.
(Round to one decimal place as needed.)
The 95% confidence interval for the difference (men−women) is negative %,%.
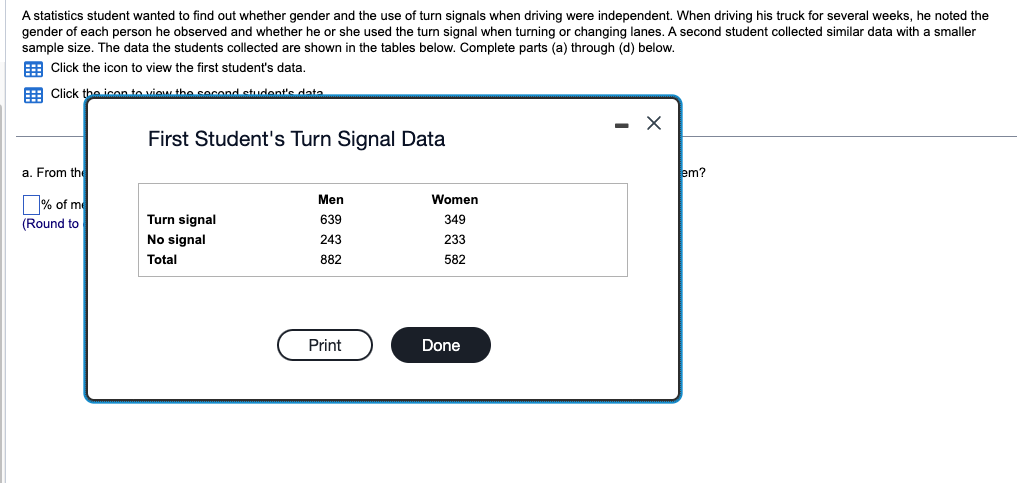
Transcribed Image Text:A statistics student wanted to find out whether gender and the use of turn signals when driving were independent. When driving his truck for several weeks, he noted the
gender of each person he observed and whether he or she used the turn signal when turning or changing lanes. A second student collected similar data with a smaller
sample size. The data the students collected are shown in the tables below. Complete parts (a) through (d) below.
Click the icon to view the first student's data.
Click the icon to view the second student's data
a. From the
% of me
(Round to
First Student's Turn Signal Data
Turn signal
No signal
Total
Men
639
243
882
Print
Women
349
233
582
Done
- X
em?
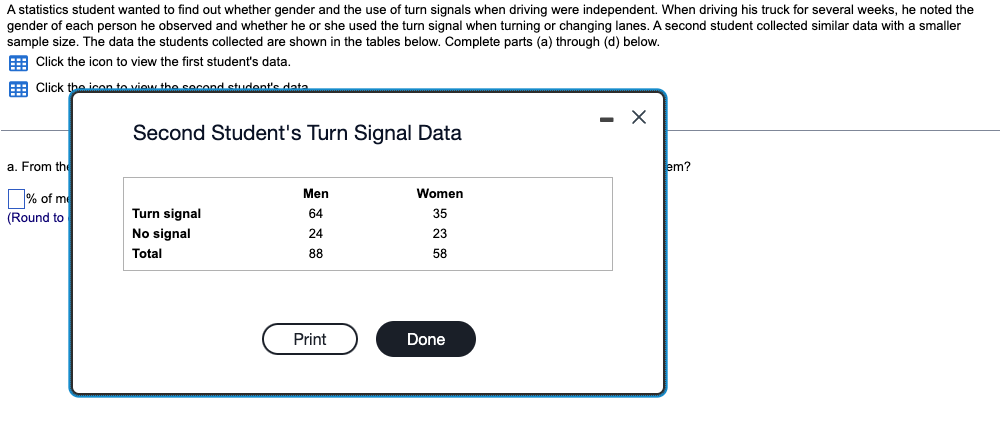
Transcribed Image Text:A statistics student wanted to find out whether gender and the use of turn signals when driving were independent. When driving his truck for several weeks, he noted the
gender of each person he observed and whether he or she used the turn signal when turning or changing lanes. A second student collected similar data with a smaller
sample size. The data the students collected are shown in the tables below. Complete parts (a) through (d) below.
Click the icon to view the first student's data.
Click the icon to view the second student's data
a. From the
% of me
(Round to
Second Student's Turn Signal Data
Turn signal
No signal
Total
Men
64
24
88
Print
Women
35
23
58
Done
- X
em?
Expert Solution
This question has been solved!
Explore an expertly crafted, step-by-step solution for a thorough understanding of key concepts.

This is a popular solution!
Step 1: Write the given information.
VIEWStep 2: Determine the percentage of men and women used turn signals for first student's data.
VIEWStep 3: Determine the 95% confidence interval for the difference in percentages.
VIEWStep 4: Determine the percentage of men and women used turn signals for second student's data.
VIEWStep 5: Determine the 95% confidence interval for the difference in percentages.
VIEWSolution
VIEW
Trending now
This is a popular solution!

Step by step
Solved in 6 steps

Recommended textbooks for you
Glencoe Algebra 1, Student Edition, 9780079039897…
Algebra
ISBN:
9780079039897
Author:
Carter
Publisher:
McGraw Hill

Big Ideas Math A Bridge To Success Algebra 1: Stu…
Algebra
ISBN:
9781680331141
Author:
HOUGHTON MIFFLIN HARCOURT
Publisher:
Houghton Mifflin Harcourt

Holt Mcdougal Larson Pre-algebra: Student Edition…
Algebra
ISBN:
9780547587776
Author:
HOLT MCDOUGAL
Publisher:
HOLT MCDOUGAL
Glencoe Algebra 1, Student Edition, 9780079039897…
Algebra
ISBN:
9780079039897
Author:
Carter
Publisher:
McGraw Hill
Big Ideas Math A Bridge To Success Algebra 1: Stu…
Algebra
ISBN:
9781680331141
Author:
HOUGHTON MIFFLIN HARCOURT
Publisher:
Houghton Mifflin Harcourt
Holt Mcdougal Larson Pre-algebra: Student Edition…
Algebra
ISBN:
9780547587776
Author:
HOLT MCDOUGAL
Publisher:
HOLT MCDOUGAL

Functions and Change: A Modeling Approach to Coll…
Algebra
ISBN:
9781337111348
Author:
Bruce Crauder, Benny Evans, Alan Noell
Publisher:
Cengage Learning