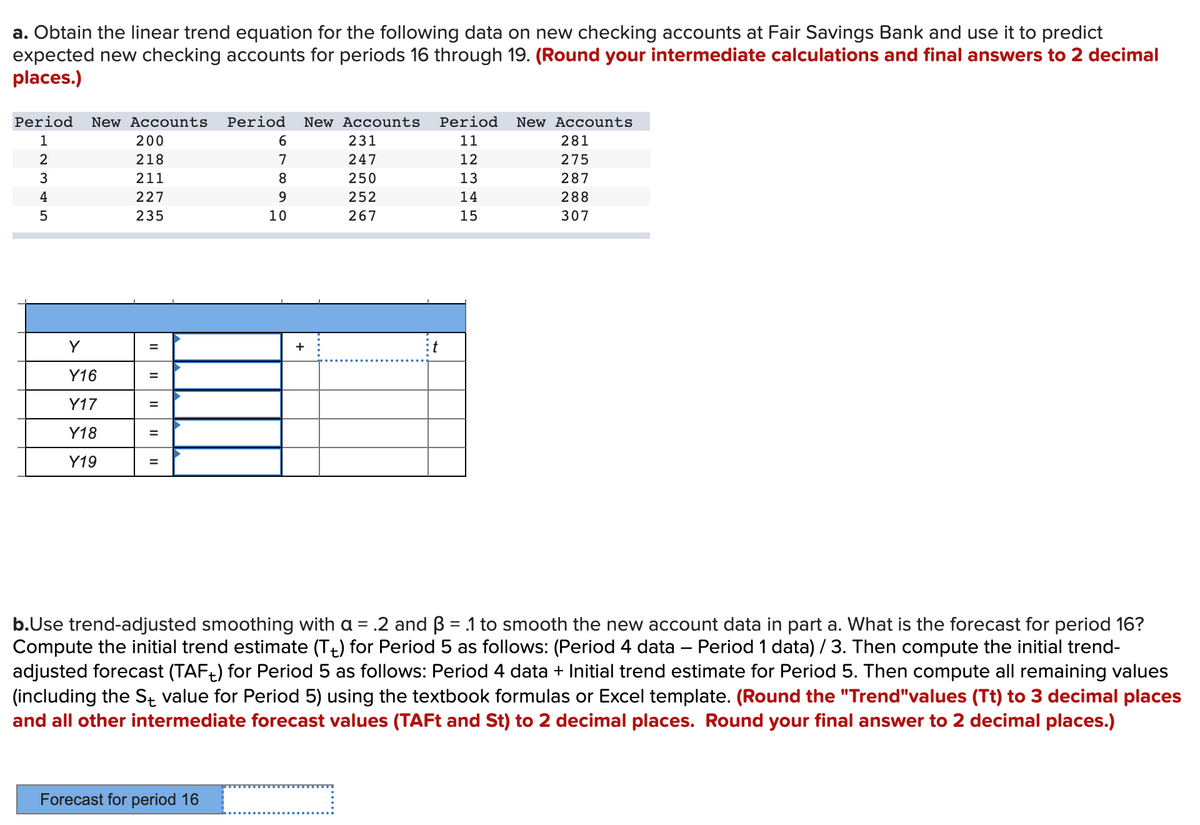
a. Obtain the linear trend equation for the following data on new checking accounts at Fair Savings Bank and use it to predict expected new checking accounts for periods 16 through 19. (Round your intermediate calculations and final answers to 2 decimal places.) Period New Accounts Period New Accounts Period New Accounts 1 11 2 3 4 5 Y Y16 Y17 Y18 Y19 200 218 211 227 235 = = = = = 6 7 8 9 10 Forecast for period 16 + 231 247 250 252 267 it 12 13 14 15 281 275 287 288 307 b.Use trend-adjusted smoothing with a = .2 and 3 = .1 to smooth the new account data in part a. What is the forecast for period 16? Compute the initial trend estimate (T) for Period 5 as follows: (Period 4 data - Period 1 data) / 3. Then compute the initial trend- adjusted forecast (TAF+) for Period 5 as follows: Period 4 data + Initial trend estimate for Period 5. Then compute all remaining values (including the St value for Period 5) using the textbook formulas or Excel template. (Round the "Trend"values (Tt) to 3 decimal places and all other intermediate forecast values (TAFt and St) to 2 decimal places. Round your final answer to 2 decimal places.)
a. Obtain the linear trend equation for the following data on new checking accounts at Fair Savings Bank and use it to predict expected new checking accounts for periods 16 through 19. (Round your intermediate calculations and final answers to 2 decimal places.) Period New Accounts Period New Accounts Period New Accounts 1 11 2 3 4 5 Y Y16 Y17 Y18 Y19 200 218 211 227 235 = = = = = 6 7 8 9 10 Forecast for period 16 + 231 247 250 252 267 it 12 13 14 15 281 275 287 288 307 b.Use trend-adjusted smoothing with a = .2 and 3 = .1 to smooth the new account data in part a. What is the forecast for period 16? Compute the initial trend estimate (T) for Period 5 as follows: (Period 4 data - Period 1 data) / 3. Then compute the initial trend- adjusted forecast (TAF+) for Period 5 as follows: Period 4 data + Initial trend estimate for Period 5. Then compute all remaining values (including the St value for Period 5) using the textbook formulas or Excel template. (Round the "Trend"values (Tt) to 3 decimal places and all other intermediate forecast values (TAFt and St) to 2 decimal places. Round your final answer to 2 decimal places.)

Practical Management Science
6th Edition
ISBN:9781337406659
Author:WINSTON, Wayne L.
Publisher:WINSTON, Wayne L.
Chapter13: Regression And Forecasting Models
Section: Chapter Questions
Problem 44P

Related questions
Question
100%
Operations Management question. Please help thanks
Transcribed Image Text:a. Obtain the linear trend equation for the following data on new checking accounts at Fair Savings Bank and use it to predict
expected new checking accounts for periods 16 through 19. (Round your intermediate calculations and final answers to 2 decimal
places.)
Period New Accounts Period New Accounts Period New Accounts
1
11
2
12
3
13
14
15
UAU
4
5
Y
Y16
Y17
Y18
Y19
200
218
211
227
235
=
=
||| ||
=
=
=
6
7
8
9
10
Forecast for period 16
+
231
247
250
252
267
t
281
275
287
288
307
b.Use trend-adjusted smoothing with a = .2 and 3 = .1 to smooth the new account data in part a. What is the forecast for period 16?
Compute the initial trend estimate (T) for Period 5 as follows: (Period 4 data – Period 1 data) / 3. Then compute the initial trend-
adjusted forecast (TAF) for Period 5 as follows: Period 4 data + Initial trend estimate for Period 5. Then compute all remaining values
(including the S value for Period 5) using the textbook formulas or Excel template. (Round the "Trend"values (Tt) to 3 decimal places
and all other intermediate forecast values (TAFt and St) to 2 decimal places. Round your final answer to 2 decimal places.)
Expert Solution
This question has been solved!
Explore an expertly crafted, step-by-step solution for a thorough understanding of key concepts.

This is a popular solution!

Trending now
This is a popular solution!

Step by step
Solved in 2 steps with 4 images

Recommended textbooks for you
Practical Management Science
Operations Management
ISBN:
9781337406659
Author:
WINSTON, Wayne L.
Publisher:
Cengage,
Practical Management Science
Operations Management
ISBN:
9781337406659
Author:
WINSTON, Wayne L.
Publisher:
Cengage,