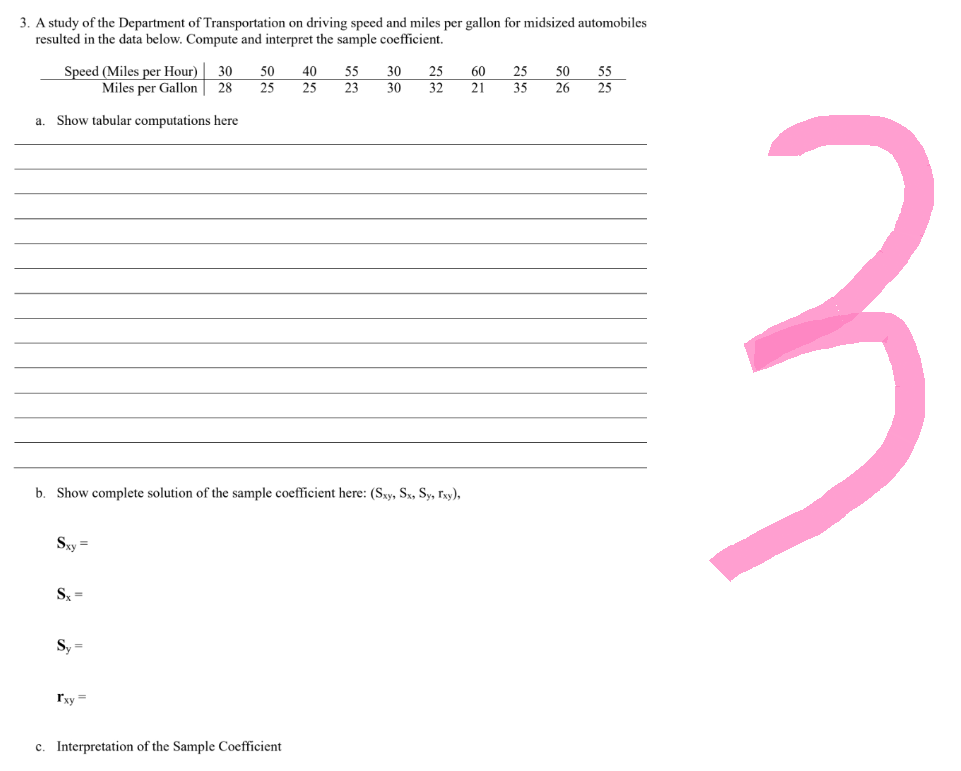
Miles per Gallon 28 a. Show tabular computations here b. Show complete solution of the sample coefficient here: (Sxy, Sx, Sy, Txy), Sxy= Sx= Sy= 25 25 23 30 32 21 I'xy c. Interpretation of the Sample Coefficient 35 26 25 3


Q: Find the probability of no correct answers.
A: Let p be probability of getting correct answer. Given that p = 0.20 Let X denote the number of…
Q: following data represent the weights (in grams) of a simple random sample of a candy. 0.92 0.90 0.89…
A: The given data is; 0.92,0.90,0.89,0.93,0.92,0.86,0.93,0.87,0.81,0.90
Q: In a study of government financial aid for college students, it becomes necessary to estimate the…
A: From the provided information, Margin of error (E) = 0.03 Confidence level = 99%
Q: The following data represent the amount of time (in minutes) a random sample of eight students took…
A:
Q: Let A and B have the joint probability density function f(a,b) = 6(1-a - b) for a+b 0, b>0 and it is…
A: Given that, A and B have joint pdf: f(a,b)= 6(1-a-b) , a+b>1, a>0, b>0
Q: Lunch break: In a recent survey of 607 working Americans ages 25-34, the average weekly amount spent…
A: given data μ = 42.92σ = 2.83normal distribution.
Q: Data was collected on the number of traffic fatalities per year in a variety of vehicles and for a…
A: The formula of the range is, Max denotes the Maximum value. Min denotes the Minimum value.
Q: Find the value of 80th percentile Find D5 Find Q1
A: Since you have posted a question with multiple sub-parts, we will solve first three subparts for…
Q: A medical test is available to determine whether a patient has a certain disease. To determine the…
A: Given information: Total number of people tested = 10100 Only 100 of these people have the…
Q: 6. Suppose that A and B are two events such that P(A) = 0.8 and P(B) = 0.6. What is the smallest…
A: Answer:- Given A and B are two events such that P(A) = 0.8 and P(B) = 0.6 What is…
Q: -1 0 Z-distribution =130 (approximately) 1 ABC 2 3 Consider the figure above. A scientist tried…
A: Given Sample size 3,5,20
Q: 4) Which among the following experimental set-ups (a, b, c) have a lesser experimental error?…
A: Experimental error: It may be defined as the difference between observed value and true value. It is…
Q: ompanying data are lengths (inches) of bears. Find P5. 35.5, 37.5, 39.5, 39.5, 41.5 ,43.0, 43.5,…
A: Given: The data given is as below 35.5 37.5 39.5 39.5 41.5 43 43.5 45.5 46…
Q: In a survey of 1500 Filipinos, 15% said they believed in horoscope. Calculate a two-sided confidence…
A: We have given that, Sample size (n) = 1500 and sample proportion (p̂) = 0.15 Then, We will find…
Q: The accompanying relative frequency ogive represents the composite score on a standardized test for…
A: From given Ogive curve ( d ) Five percent of students had a composite score above what level ?
Q: 8) A normal random variable x has an unknown mean and the standard deviation. The probability that X…
A:
Q: K dogs, each of size n=15, are randomly collected and the sample means are found. Is it correct to…
A: Central limit theorem: If the size of the samples taken from the population are sufficiently…
Q: (a) If you draw 5 cards, one at a time, placing each card back into the deck and shuffling before…
A: Here given , An iteration of the board game Candyland has the following cards: 6 each of red,…
Q: True or False: The closer the correlation coefficient, r, is to zero, the weaker the linear…
A: We have to interpret the values of correlation coefficient r
Q: 3) Differentiate replication and ranndomization.
A: Given that We have to differentiate between randomisation and replication
Q: Find the percentage of students that scores higher than 95.5 round your answer to the nearest…
A: From the given histogram we have to find percentage of students that scores higher than 95.5
Q: a) Determine the range and standard deviation of the amounts R SD b) Add $10 to each of the six…
A: It is given that the data of six people’s amount of money they were carrying: $32, $60, $14, $25,…
Q: If 10 percent of the balls in a certain box are red, and if 20 balls are selected from the box at…
A:
Q: 1. Replace ??MEAN with the ython funct 2. Replace ??MEDIAN_FUNCTION?? 3. Replace ??VAR_FUNCTION?? 4.…
A: The mean using the python code is given as: Input > import statistics >…
Q: Lunch break: In a recent survey of 607 working Americans ages 25-34, the average weekly amount spent…
A: given data,in a recent survey of 607 working americans ages 25 - 34 the avarage amount= μ = 42.92…
Q: Let X be a random variable which represents the lifetime in years of a particular battery. We are…
A: Given: X follows exponential distribution λ=0.15 Asper guidelines only first three subparts has…
Q: 6. In all the state of the union (SOTU) addresses since that of President George Washington in the…
A: Since you have posted a question with multiple sub-parts, we will solve first three subparts for…
Q: The retirement age of National Football League (NFL) players is Normally distributed with a mean of…
A: Given: Mean μ = 33 Standard deviation σ = 2 Formula Used: Z-score = X-μσ
Q: 6) The probability distribution of a random variable D is the density curve of a uniform…
A: Given X~Uniform(0.2,0.7) Result: When X~U(a,b) then f(x)=1/(b-a) a<x<b And CDF will be…
Q: Students’ ID numbers are______ variable? A. Discrete B. Continuous C. Nominal D. Ordinal
A: The statement is 'the type of variable for Students' ID numbers'.
Q: Here are the shopping times (in minutes) for a sample of 17 shoppers at a particular clothing store:…
A: Given: Sample size n = 17 Initial class boundary = 21.5 Class width = 5
Q: As preparation for designing a new line of business wear, a clothing manufacturer asked a large…
A: concept:Pie chart are used for graphical representation of quantitative data
Q: What is the probability that Helen succeeds in both shots?
A: It is given that two events C : The event that Helen succeeds on the first shot. P(C) = 0.50 D :…
Q: What is that spread? Which interval has the most data in it? 35 - 47 47 - 58 58 - 69 19 - 37 What…
A: Answer: 1. Spread: It measure of how far the data ranges from the center of data. Here Minimum…
Q: (4) The following data examines whether there is a relationship between the number of absences in a…
A: Given: Absences (x) Final Grade (y) 6 74 9 60 4 75 2 87 0 92 5 74 4 80 3 82 6…
Q: (1 point) A manufacturer sells a light bulb that has a mean life of 1515 hours with a standard…
A:
Q: Each person in a community was asked, "What is your favorite type of pet?" The pie chart below…
A: Concept:Pie chart are used for graphical representation of quantitative data.
Q: (d) Calculate the fitted y, for each value of x; used to fit the model. Then construct a graph of ŷ,…
A: Given data: Taxes Sale price 4.9176 25.9 5.0208 29.5 4.5429 27.9 4.5573 25.9 5.0597…
Q: x+y 150 Suppose the joint probability distribution of X and Y is given by f(x,y) = (a) Find P(X…
A: Probability is the likelihood of observation happen in the data set. It is calculated by dividing…
Q: Compute the mean and variance for the linear function W = 2X - 4Y.
A: It is given that For X, mean = 1.3, Variance = 0.21 For Y, mean = 0.3, Variance = 0.21 Cov(X, Y) =…
Q: K- Assume that the sample is a simple random sample obtained from a normally distributed population…
A: It is given that Level of confidence = 99% Margin of error = 1%
Q: Question 16 A small choir has 7 members with the following ages: 22,35,27,40,27,29,38. The 14th…
A:
Q: Suppose that 47% of people own dogs. If you pick two people at random, what is the probability that…
A: We have given that Probability (p) = 0.35number of sample (n) = 2 Here we will use binomial…
Q: The thickness (in millimeters) of the coating applied to hard drives is one characteristic that…
A: As asked, I have answered question number D only. Please find the solution below. Thank you.
Q: Suppose that shoe sizes of American women have a bell-shaped distribution with a mean of 8.338.33…
A: Given: Mean, μ = 8.33 Std deviation, σ = 1.48
Q: A personnel director has hired ten new employees, whom she can assign to work in various positions.…
A: Given that A Personnel director has hired ten new employees. Number of employees hired (n) = 10…
Q: The following are ages in years of nine employees of a large company. 46, 22, 35, 26, 22, 53, 33,…
A: Given that x x2 46 2116 22 484 35 1225 26 676 22 484 53 2809 33 1089 42 1764…
Q: The standard deviation of the mean is less than the sample standard deviation because it estimates…
A: Given that True or False The standard deviation of the mean is less than the sample standard…
Q: Use a stem-and-leaf plot to display the data, which represent the numbers of hours 24 nurses work…
A: here we have find out stem and leaf plot for given data40 , 40 , 48 , 48 , 30 , 40 , 36 , 56 , 32 ,…
Q: Find the CDF of an exponential random variable with mean 1/λ .
A: Solution
DO THIS TYPEWRITTEN FOR UPVOTE

Step by step
Solved in 4 steps

- If a researcher reported for a single-sample t-test that t(17) = 2.90, p<.02, how many subjects were there in the study?If a researcher reported for a single-sample t-test that t(17) = 2.90, p< 0.02, how many subjects were there in the study? A. 20 B. 10 C. 9 D. 18Determine if there is a significant difference among the samples. A1 A2 A3 35 46 37 44 41 26 49 31 34 52 42 53 33 36 41 Total 213 196 191 State your hypothesis and show your solution and state your final conclusion.
- Consider sample data with x = 12 and s = 3. (a) Compute the coefficient of variation.With a sample size of 5, the P(t<x)=0.57P(t<x)=0.57. What is xxIn a lightbulb factory, an administrator selects a random sample of bulbs produced on assembly line A and a random sample of bulbs produced on assembly line B. The administrator calculates the proportion of malfunctioning bulbs produced by each assembly line and finds that the difference between them (A - B) is 0.008. A researcher conducted a hypothesis test with the following hypotheses: H0: The proportion of malfunctioning bulbs from assembly line A is the sample as the proportion of malfunctioning bulbs from assembly line B. HA: The proportion of malfunctioning bulbs from assembly line A is greater than the proportion of malfunctioning bulbs from assembly line B. She found a P-value of 0.016. What is the best interpretation of this P-value? a If there is no difference in the proportions of all defective parts made on the two assembly lines, the probability of observing a difference of at least 0.008 is 0.016. b If there is a difference of 0.016 in the proportions…
- A state-by-state survey found that the proportions of adults who are smokers in state A and state B were 23.1% and 17.2%, respectively. (Suppose the number of respondents from each state was 2000.) At α=0.05, can you support the claim that the proportion of adults who are smokers is greater in state A than in state B? Assume the random samples are independent. Complete parts (a) through (e).1.Find the measured variable x, write X's data type, write the sample size n, and describe the population of interest for each problem. a. An analyst records 30 randomly selected stock values b. Your company's marketing specialist randomly selects and records 120 scanned item types. c. To examine pesticide limits in a large lake, the FDA captures 25 fish from the lake and measures the pesticide level in each fish. d. A lumber yard manager selects 200 random paint can sales and records each paint color.The total size of a university is 7,610. Determine the sample size for a study using the COchran's formula provided that Z = 1.96 and e = 0.05
- If we are testing for the difference between the means of 2 related populations with samples of n1=20 and n2=20, the number of degrees of freedom is equal to ________. a. 18 b. 19 c. 38 d. 39Where are the deer? Random samples of square-kilometer plots were taken in different ecological locations of a national park. The deer counts per square kilometer were recorded and are shown in the following table. Mountain Brush Sagebrush Grassland Pinon Juniper 30 21 2 26 58 6 20 13 8 31 20 13 Find SSTOT, SSBET, and SSW and check that SSTOT = SSBET + SSW. (Use 3 decimal places.) SSTOT = SSBET = SSW = Find d.f.BET, d.f.W, MSBET, and MSW. (Use 2 decimal places for MSBET, and MSW.) dfBET = dfW = MSBET = MSW = Find the value of the sample F statistic. (Use 3 decimal places.) What are the degrees of freedom? Find the P-value of the sample test statistic. Make a summary table for your ANOVA test.4. For a sample of 12 observations, a businessman wants to regress the price (in dollar) of the laptop (Y) on the processor's speed (X). The summary results of the observations are given below. Σx = 19.8 , Σy = 24798, Σxy = 431882 Σx^2 = 3388, Σγ^2 = 57365692 (c) Find the predicted price of the laptop (y) for the processor speed x-1.9. (d) Compute the coefficient of determination and comment.