A. Suppose Venezuela produces only 2 goods: beef and oil. If it only produces beef, it can produce 300 million pounds. If it only produces oil, it can produces 50 million barrels. 1. Put beef on the y-axis, and oil on the x-axis. Graph the production possibility frontier of Venezuela. 2. What is the opportunity cost of a pound of beef and what is the opportunity cost of a barrel of oil? 3. Derive the equation of the PPF line you just drew. What does the value of the slope mean intuitively?
A. Suppose Venezuela produces only 2 goods: beef and oil. If it only produces beef, it can produce 300 million pounds. If it only produces oil, it can produces 50 million barrels. 1. Put beef on the y-axis, and oil on the x-axis. Graph the production possibility frontier of Venezuela. 2. What is the opportunity cost of a pound of beef and what is the opportunity cost of a barrel of oil? 3. Derive the equation of the PPF line you just drew. What does the value of the slope mean intuitively?

Brief Principles of Macroeconomics (MindTap Course List)
8th Edition
ISBN:9781337091985
Author:N. Gregory Mankiw
Publisher:N. Gregory Mankiw
Chapter3: Interdependence And The Gains Rrom Trade
Section: Chapter Questions
Problem 2PA

Related questions
Question
Transcribed Image Text:Problem Set 1
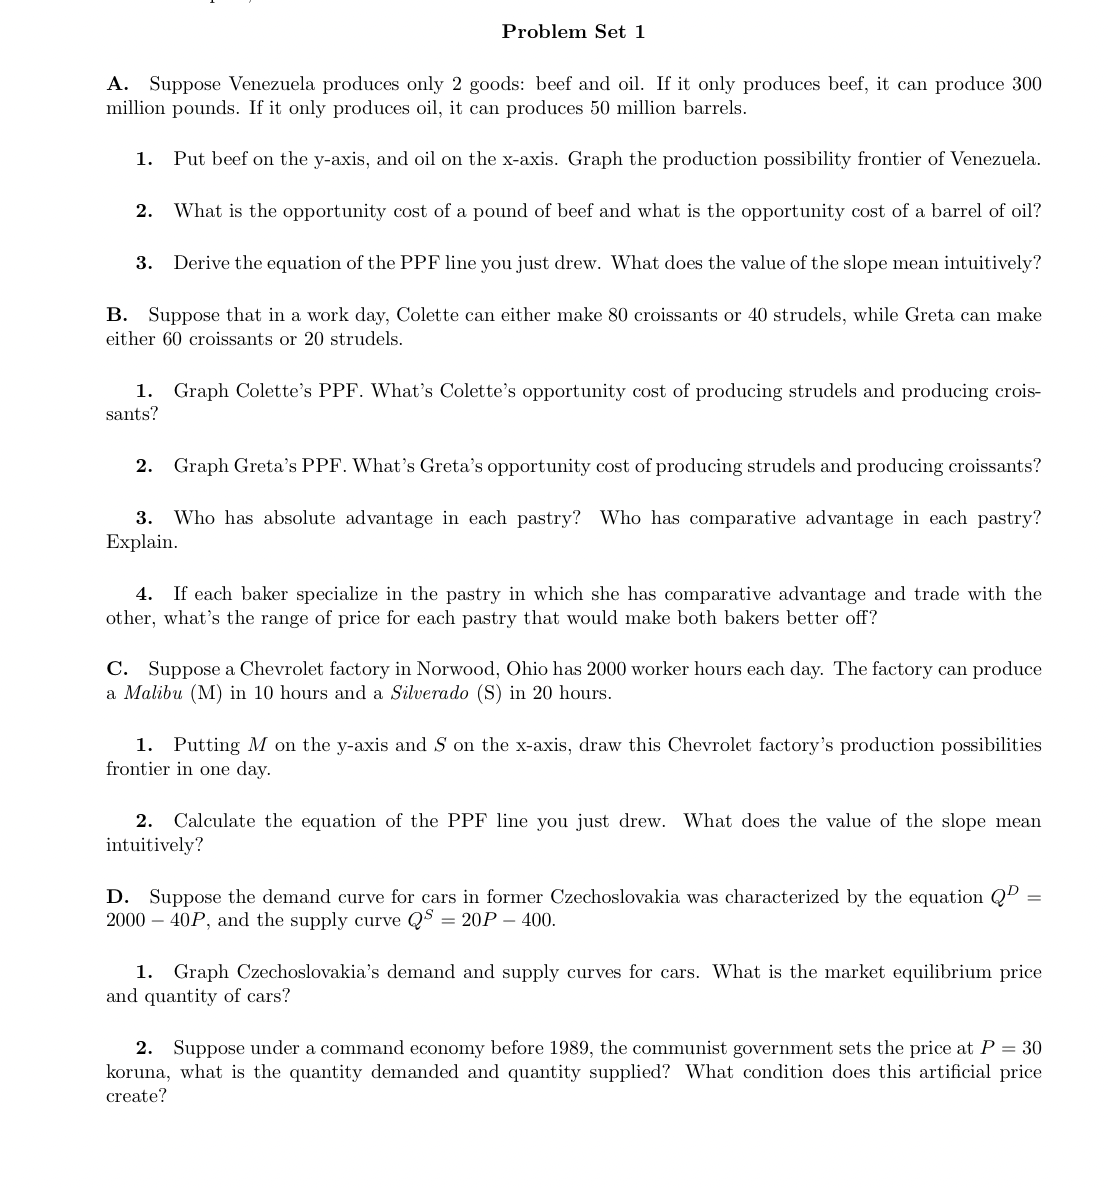
A. Suppose Venezuela produces only 2 goods: beef and oil. If it only produces beef, it can produce 300
million pounds. If it only produces oil, it can produces 50 million barrels.
1. Put beef on the y-axis, and oil on the x-axis. Graph the production possibility frontier of Venezuela.
2. What is the opportunity cost of a pound of beef and what is the opportunity cost of a barrel of oil?
3. Derive the equation of the PPF line you just drew. What does the value of the slope mean intuitively?
B. Suppose that in a work day, Colette can either make 80 croissants or 40 strudels, while Greta can make
either 60 croissants or 20 strudels.
1. Graph Colette's PPF. What's Colette's opportunity cost of producing strudels and producing crois-
sants?
2. Graph Greta's PPF. What's Greta's opportunity cost of producing strudels and producing croissants?
3. Who has absolute advantage in each pastry? Who has comparative advantage in each pastry?
Explain.
4. If each baker specialize in the pastry in which she has comparative advantage and trade with the
other, what's the range of price for each pastry that would make both bakers better off?
C. Suppose a Chevrolet factory in Norwood, Ohio has 2000 worker hours each day. The factory can produce
a Malibu (M) in 10 hours and a Silverado (S) in 20 hours.
1. Putting M on the y-axis and S on the x-axis, draw this Chevrolet factory's production possibilities
frontier in one day.
2. Calculate the equation of the PPF line you just drew. What does the value of the slope mean
intuitively?
D. Suppose the demand curve for cars in former Czechoslovakia was characterized by the equation Q
2000 - 40P, and the supply curve QS = 20P - 400.
1. Graph Czechoslovakia's demand and supply curves for cars. What is the market equilibrium price
and quantity of cars?
2. Suppose under a command economy before 1989, the communist government sets the price at P = 30
koruna, what is the quantity demanded and quantity supplied? What condition does this artificial price
create?
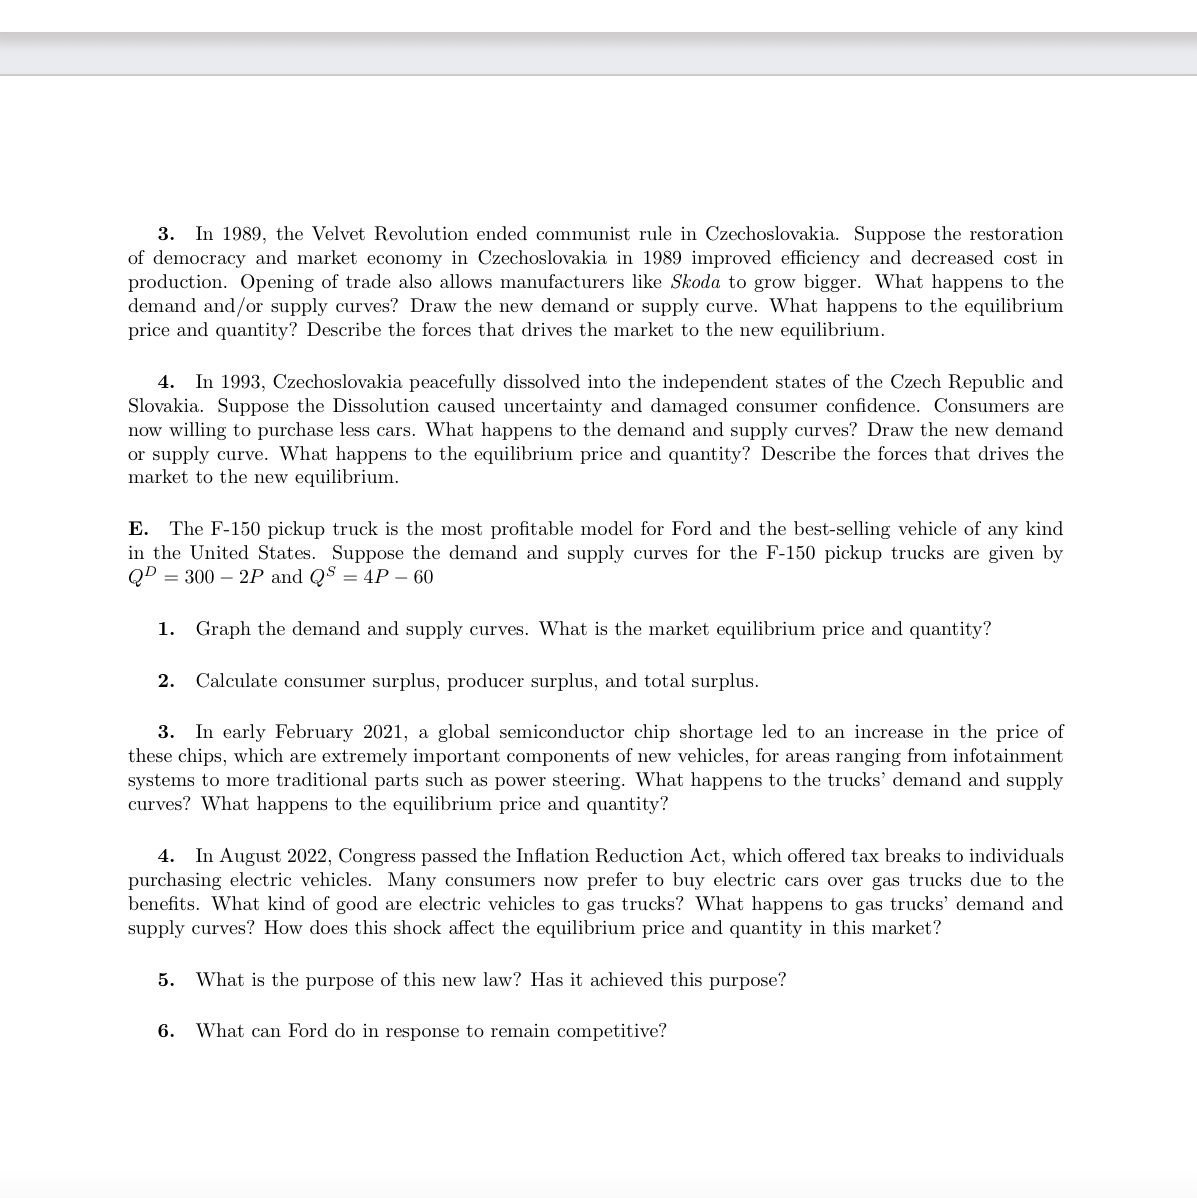
Transcribed Image Text:3. In 1989, the Velvet Revolution ended communist rule in Czechoslovakia. Suppose the restoration
of democracy and market economy in Czechoslovakia in 1989 improved efficiency and decreased cost in
production. Opening of trade also allows manufacturers like Skoda to grow bigger. What happens to the
demand and/or supply curves? Draw the new demand or supply curve. What happens to the equilibrium
price and quantity? Describe the forces that drives the market to the new equilibrium.
4. In 1993, Czechoslovakia peacefully dissolved into the independent states of the Czech Republic and
Slovakia. Suppose the Dissolution caused uncertainty and damaged consumer confidence. Consumers are
now willing to purchase less cars. What happens to the demand and supply curves? Draw the new demand
or supply curve. What happens to the equilibrium price and quantity? Describe the forces that drives the
market to the new equilibrium.
E. The F-150 pickup truck is the most profitable model for Ford and the best-selling vehicle of any kind
in the United States. Suppose the demand and supply curves for the F-150 pickup trucks are given by
QD = 300 - 2P and Qs = 4P - 60
1. Graph the demand and supply curves. What is the market equilibrium price and quantity?
2. Calculate consumer surplus, producer surplus, and total surplus.
3. In early February 2021, a global semiconductor chip shortage led to an increase in the price of
these chips, which are extremely important components of new vehicles, for areas ranging from infotainment
systems to more traditional parts such as power steering. What happens to the trucks' demand and supply
curves? What happens to the equilibrium price and quantity?
4. In August 2022, Congress passed the Inflation Reduction Act, which offered tax breaks to individuals
purchasing electric vehicles. Many consumers now prefer to buy electric cars over gas trucks due to the
benefits. What kind of good are electric vehicles to gas trucks? What happens to gas trucks' demand and
supply curves? How does this shock affect the equilibrium price and quantity in this market?
5. What is the purpose of this new law? Has it achieved this purpose?
6. What can Ford do in response to remain competitive?
Expert Solution
This question has been solved!
Explore an expertly crafted, step-by-step solution for a thorough understanding of key concepts.

This is a popular solution!

Trending now
This is a popular solution!

Step by step
Solved in 4 steps with 1 images

Follow-up Questions
Read through expert solutions to related follow-up questions below.
Follow-up Question
Suppose the
Solution
Knowledge Booster


Learn more about
Need a deep-dive on the concept behind this application? Look no further. Learn more about this topic, economics and related others by exploring similar questions and additional content below.Recommended textbooks for you
Brief Principles of Macroeconomics (MindTap Cours…
Economics
ISBN:
9781337091985
Author:
N. Gregory Mankiw
Publisher:
Cengage Learning

Essentials of Economics (MindTap Course List)
Economics
ISBN:
9781337091992
Author:
N. Gregory Mankiw
Publisher:
Cengage Learning

Principles of Economics 2e
Economics
ISBN:
9781947172364
Author:
Steven A. Greenlaw; David Shapiro
Publisher:
OpenStax
Brief Principles of Macroeconomics (MindTap Cours…
Economics
ISBN:
9781337091985
Author:
N. Gregory Mankiw
Publisher:
Cengage Learning
Essentials of Economics (MindTap Course List)
Economics
ISBN:
9781337091992
Author:
N. Gregory Mankiw
Publisher:
Cengage Learning
Principles of Economics 2e
Economics
ISBN:
9781947172364
Author:
Steven A. Greenlaw; David Shapiro
Publisher:
OpenStax

Principles of Economics, 7th Edition (MindTap Cou…
Economics
ISBN:
9781285165875
Author:
N. Gregory Mankiw
Publisher:
Cengage Learning

Principles of Economics (MindTap Course List)
Economics
ISBN:
9781305585126
Author:
N. Gregory Mankiw
Publisher:
Cengage Learning

Principles of Macroeconomics (MindTap Course List)
Economics
ISBN:
9781285165912
Author:
N. Gregory Mankiw
Publisher:
Cengage Learning