a.) The individual object in the study was a randomly selected This is computer-graded so use exact wording from the problem above. b.) What was the variable information recorded for each object in the study? This is computer-graded so use exact wording from the problem above. c.) State the statistical interpretation of the confidence interval in the context of this problem. Select an answer student is/are between ? ✓ = d.) What is the symbol and value of the point estimate for u? ✓the e.) What is the margin of error for the given interval? A = B = points points Remember: the sample statistic is the midpoint of the confidence interval, and the difference between the highest and lowest value of your interval (its width) is the two times the margin of error. -B- final exam score of ? Harper statistics f.) Fill in the boxes below to show the relation on the number line between the numeric values of the point estimate and the interval estimate for u. C = and
a.) The individual object in the study was a randomly selected This is computer-graded so use exact wording from the problem above. b.) What was the variable information recorded for each object in the study? This is computer-graded so use exact wording from the problem above. c.) State the statistical interpretation of the confidence interval in the context of this problem. Select an answer student is/are between ? ✓ = d.) What is the symbol and value of the point estimate for u? ✓the e.) What is the margin of error for the given interval? A = B = points points Remember: the sample statistic is the midpoint of the confidence interval, and the difference between the highest and lowest value of your interval (its width) is the two times the margin of error. -B- final exam score of ? Harper statistics f.) Fill in the boxes below to show the relation on the number line between the numeric values of the point estimate and the interval estimate for u. C = and

Holt Mcdougal Larson Pre-algebra: Student Edition 2012
1st Edition
ISBN:9780547587776
Author:HOLT MCDOUGAL
Publisher:HOLT MCDOUGAL
Chapter11: Data Analysis And Probability
Section: Chapter Questions
Problem 8CR

Related questions
Question
The final exam score was recorded for each Harper statistics student in a sample of 30. A 95% confidence interval for
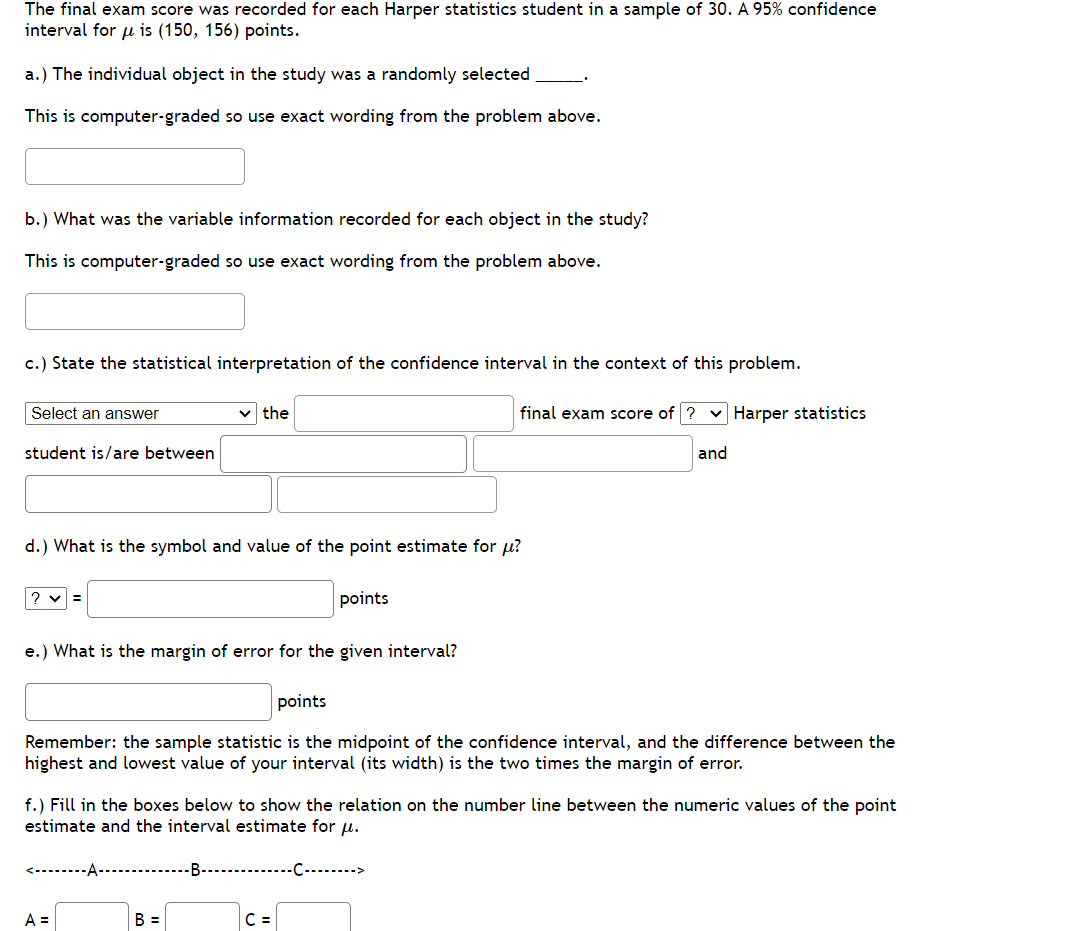
Transcribed Image Text:The final exam score was recorded for each Harper statistics student in a sample of 30. A 95% confidence
interval for u is (150, 156) points.
a.) The individual object in the study was a randomly selected
This is computer-graded so use exact wording from the problem above.
b.) What was the variable information recorded for each object in the study?
This is computer-graded so use exact wording from the problem above.
c.) State the statistical interpretation of the confidence interval in the context of this problem.
Select an answer
student is/are between
?v=
d.) What is the symbol and value of the point estimate for u?
the
e.) What is the margin of error for the given interval?
<--------A-
A =
points
points
Remember: the sample statistic is the midpoint of the confidence interval, and the difference between the
highest and lowest value of your interval (its width) is the two times the margin of error.
B =
f.) Fill in the boxes below to show the relation on the number line between the numeric values of the point
estimate and the interval estimate for μ.
final exam score of ? Harper statistics
-B-C->
C =
and
Expert Solution
This question has been solved!
Explore an expertly crafted, step-by-step solution for a thorough understanding of key concepts.

Step by step
Solved in 3 steps with 13 images

Recommended textbooks for you
Holt Mcdougal Larson Pre-algebra: Student Edition…
Algebra
ISBN:
9780547587776
Author:
HOLT MCDOUGAL
Publisher:
HOLT MCDOUGAL
Holt Mcdougal Larson Pre-algebra: Student Edition…
Algebra
ISBN:
9780547587776
Author:
HOLT MCDOUGAL
Publisher:
HOLT MCDOUGAL