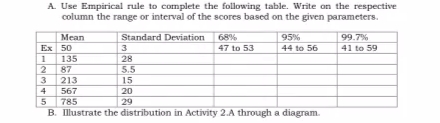
A. Use Empirical rule to complete the following table. Write on the respective column the range or interval of the scores based on the given parameters. Mean Ex 50 135 87 Standard Deviation 68% 47 to 53 95% 99.7% 41 to 59 44 to 56 28 S.S 15 20 [2 3 213 567 785 29 B. Illustrate the distribution in Activity 2.A through a diagram.
A. Use Empirical rule to complete the following table. Write on the respective column the range or interval of the scores based on the given parameters. Mean Ex 50 135 87 Standard Deviation 68% 47 to 53 95% 99.7% 41 to 59 44 to 56 28 S.S 15 20 [2 3 213 567 785 29 B. Illustrate the distribution in Activity 2.A through a diagram.

Glencoe Algebra 1, Student Edition, 9780079039897, 0079039898, 2018
18th Edition
ISBN:9780079039897
Author:Carter
Publisher:Carter
Chapter10: Statistics
Section10.5: Comparing Sets Of Data
Problem 14PPS

Related questions

Question
100%
Transcribed Image Text:A. Use Empirical rule to complete the following table. Write on the respective
column the range or interval of the scores based on the given parameters.
Standard Deviation
68%
95%
Mean
Ex 50
135
99.7%
41 to 59
3
47 to 53
44 to 56
1
2
28
87
5.5
15
3
213
4
567
785
B. Illustrate the distribution in Activity 2.A through a diagram.
20
5
29
Expert Solution
This question has been solved!
Explore an expertly crafted, step-by-step solution for a thorough understanding of key concepts.

This is a popular solution!

Trending now
This is a popular solution!

Step by step
Solved in 3 steps with 1 images

Knowledge Booster


Learn more about
Need a deep-dive on the concept behind this application? Look no further. Learn more about this topic, probability and related others by exploring similar questions and additional content below.Recommended textbooks for you
Glencoe Algebra 1, Student Edition, 9780079039897…
Algebra
ISBN:
9780079039897
Author:
Carter
Publisher:
McGraw Hill
Glencoe Algebra 1, Student Edition, 9780079039897…
Algebra
ISBN:
9780079039897
Author:
Carter
Publisher:
McGraw Hill