1. The dot plots show the ages of people at two different movies at a schoo movie night. Which data set seems to have greater variability? Ages at Movie A Ages at Movie B 6 7 8 9 10 11 12 13 14 15 16 17 18 6 7 8 9 10 11 12 13 14 15 16 17 18 2. Use the data sets in Item 1. What is the mean absolute deviation of the ages at Movie B? A 0 B 1.25 1.4 D 16
1. The dot plots show the ages of people at two different movies at a schoo movie night. Which data set seems to have greater variability? Ages at Movie A Ages at Movie B 6 7 8 9 10 11 12 13 14 15 16 17 18 6 7 8 9 10 11 12 13 14 15 16 17 18 2. Use the data sets in Item 1. What is the mean absolute deviation of the ages at Movie B? A 0 B 1.25 1.4 D 16

Glencoe Algebra 1, Student Edition, 9780079039897, 0079039898, 2018
18th Edition
ISBN:9780079039897
Author:Carter
Publisher:Carter
Chapter10: Statistics
Section10.5: Comparing Sets Of Data
Problem 14PPS

Related questions
Question
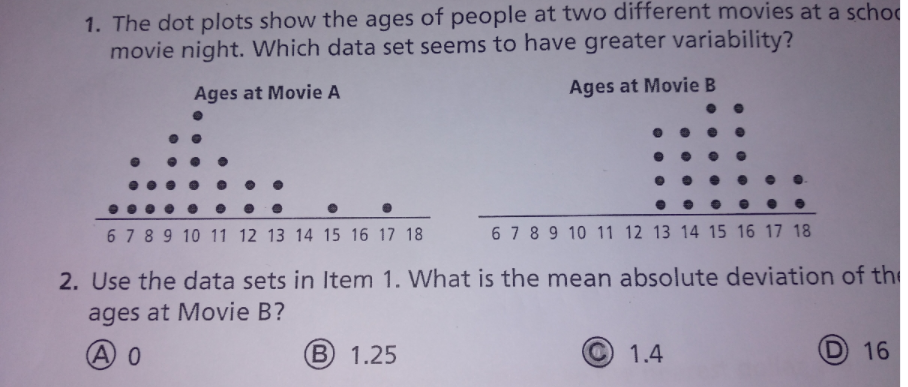
Transcribed Image Text:1. The dot plots show the ages of people at two different movies at a schoo
movie night. Which data set seems to have greater variability?
Ages at Movie A
Ages at Movie B
6 7 8 9 10 11 12 13 14 15 16 17 18
6 7 8 9 10 11 12 13 14 15 16 17 18
2. Use the data sets in Item 1. What is the mean absolute deviation of the
ages at Movie B?
A 0
B 1.25
1.4
D 16
Expert Solution
This question has been solved!
Explore an expertly crafted, step-by-step solution for a thorough understanding of key concepts.

This is a popular solution!

Trending now
This is a popular solution!

Step by step
Solved in 2 steps with 2 images

Recommended textbooks for you
Glencoe Algebra 1, Student Edition, 9780079039897…
Algebra
ISBN:
9780079039897
Author:
Carter
Publisher:
McGraw Hill
Glencoe Algebra 1, Student Edition, 9780079039897…
Algebra
ISBN:
9780079039897
Author:
Carter
Publisher:
McGraw Hill