a.) Using the confidence interval approach, state and explain whether the variable 'AGE' is statistically significant or not. Use 5% level of significance, which give 1.96 critical value.
a.) Using the confidence interval approach, state and explain whether the variable 'AGE' is statistically significant or not. Use 5% level of significance, which give 1.96 critical value.

Functions and Change: A Modeling Approach to College Algebra (MindTap Course List)
6th Edition
ISBN:9781337111348
Author:Bruce Crauder, Benny Evans, Alan Noell
Publisher:Bruce Crauder, Benny Evans, Alan Noell
Chapter3: Straight Lines And Linear Functions
Section3.4: Linear Regression
Problem 8SBE

Related questions
Question
![QUESTION ONE
The table below was extracted from Stata. It is an output of a regression that was conducted
on EARNINGS in dollars (dependent variable), and the following as independent variables: AGE
(years), S (years in school), MALE (dummy for male), LIBRARY, SIBLINGS (number of siblings),
and ETHHISP (dummy for Hispanic respondents). Using the information in the table, answer
the questions below:
Source
Model
Residual
Total
EARNINGS
AGE
S
MALE
LIBRARY
SIBLINGS
ETHHISP
cons
SS
7454.91824
28115.9859
df
6 1242.48637
524 53.6564617
530 67.1149135
Coef. Std. Err.
MS
.3930994 .1467907
1.278186 .1407522
3.590323 .6458634
1.010765 .7641504
-.1085979 .1566326
-.404548
1.356467
-19.26833
5.088757
t
Number of obs
F (6, 524)
Prob > F
R-squared
Adj R-squared
Root MSE
P>|t|
0.008
9.08 0.000
5.56 0.000
1.32 0.187
-0.69 0.488
-0.30 0.766
-3.79 0.000
531
23.16
0.0000
1.001678
2.321524
-.4904096
-.4163029
-3.069328
-29.2652
0.2005
7.3251
[95% Conf. Interval]
1.554694
4.859123
2.51194
.1991072
2.260233
-9.271462](/v2/_next/image?url=https%3A%2F%2Fcontent.bartleby.com%2Fqna-images%2Fquestion%2F8d760f85-dd3e-4447-9d71-439b279fc36b%2F6eb61b4c-3ab6-4a45-859f-65afe3a74ea9%2F60c5ta08_processed.png&w=3840&q=75)
Transcribed Image Text:QUESTION ONE
The table below was extracted from Stata. It is an output of a regression that was conducted
on EARNINGS in dollars (dependent variable), and the following as independent variables: AGE
(years), S (years in school), MALE (dummy for male), LIBRARY, SIBLINGS (number of siblings),
and ETHHISP (dummy for Hispanic respondents). Using the information in the table, answer
the questions below:
Source
Model
Residual
Total
EARNINGS
AGE
S
MALE
LIBRARY
SIBLINGS
ETHHISP
cons
SS
7454.91824
28115.9859
df
6 1242.48637
524 53.6564617
530 67.1149135
Coef. Std. Err.
MS
.3930994 .1467907
1.278186 .1407522
3.590323 .6458634
1.010765 .7641504
-.1085979 .1566326
-.404548
1.356467
-19.26833
5.088757
t
Number of obs
F (6, 524)
Prob > F
R-squared
Adj R-squared
Root MSE
P>|t|
0.008
9.08 0.000
5.56 0.000
1.32 0.187
-0.69 0.488
-0.30 0.766
-3.79 0.000
531
23.16
0.0000
1.001678
2.321524
-.4904096
-.4163029
-3.069328
-29.2652
0.2005
7.3251
[95% Conf. Interval]
1.554694
4.859123
2.51194
.1991072
2.260233
-9.271462
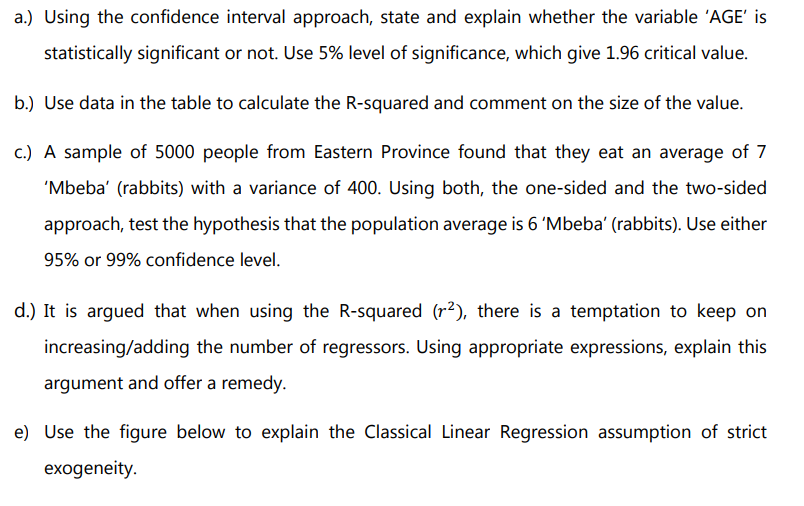
Transcribed Image Text:a.) Using the confidence interval approach, state and explain whether the variable 'AGE' is
statistically significant or not. Use 5% level of significance, which give 1.96 critical value.
b.) Use data in the table to calculate the R-squared and comment on the size of the value.
c.) A sample of 5000 people from Eastern Province found that they eat an average of 7
'Mbeba' (rabbits) with a variance of 400. Using both, the one-sided and the two-sided
approach, test the hypothesis that the population average is 6 'Mbeba' (rabbits). Use either
95% or 99% confidence level.
d.) It is argued that when using the R-squared (r²), there is a temptation to keep on
increasing/adding the number of regressors. Using appropriate expressions, explain this
argument and offer a remedy.
e) Use the figure below to explain the Classical Linear Regression assumption of strict
exogeneity.
Expert Solution
This question has been solved!
Explore an expertly crafted, step-by-step solution for a thorough understanding of key concepts.

Step by step
Solved in 2 steps with 1 images

Recommended textbooks for you
Functions and Change: A Modeling Approach to Coll…
Algebra
ISBN:
9781337111348
Author:
Bruce Crauder, Benny Evans, Alan Noell
Publisher:
Cengage Learning

Glencoe Algebra 1, Student Edition, 9780079039897…
Algebra
ISBN:
9780079039897
Author:
Carter
Publisher:
McGraw Hill

College Algebra
Algebra
ISBN:
9781305115545
Author:
James Stewart, Lothar Redlin, Saleem Watson
Publisher:
Cengage Learning
Functions and Change: A Modeling Approach to Coll…
Algebra
ISBN:
9781337111348
Author:
Bruce Crauder, Benny Evans, Alan Noell
Publisher:
Cengage Learning
Glencoe Algebra 1, Student Edition, 9780079039897…
Algebra
ISBN:
9780079039897
Author:
Carter
Publisher:
McGraw Hill
College Algebra
Algebra
ISBN:
9781305115545
Author:
James Stewart, Lothar Redlin, Saleem Watson
Publisher:
Cengage Learning

Algebra and Trigonometry (MindTap Course List)
Algebra
ISBN:
9781305071742
Author:
James Stewart, Lothar Redlin, Saleem Watson
Publisher:
Cengage Learning