a. What is the equilibrium price and quantity traded? The equilibrium price is $ and the quantity traded is b. Suppose supply increases by 20. Complete the last column in the table above. c. What would be the price and quantity traded at the new equilibrium? The equilibrium price is $l and the quantity traded is
a. What is the equilibrium price and quantity traded? The equilibrium price is $ and the quantity traded is b. Suppose supply increases by 20. Complete the last column in the table above. c. What would be the price and quantity traded at the new equilibrium? The equilibrium price is $l and the quantity traded is

Principles of Economics (MindTap Course List)
8th Edition
ISBN:9781305585126
Author:N. Gregory Mankiw
Publisher:N. Gregory Mankiw
Chapter6: Supply, Demand And Government Policies
Section: Chapter Questions
Problem 3PA

Related questions
Question
Please solve ASAP
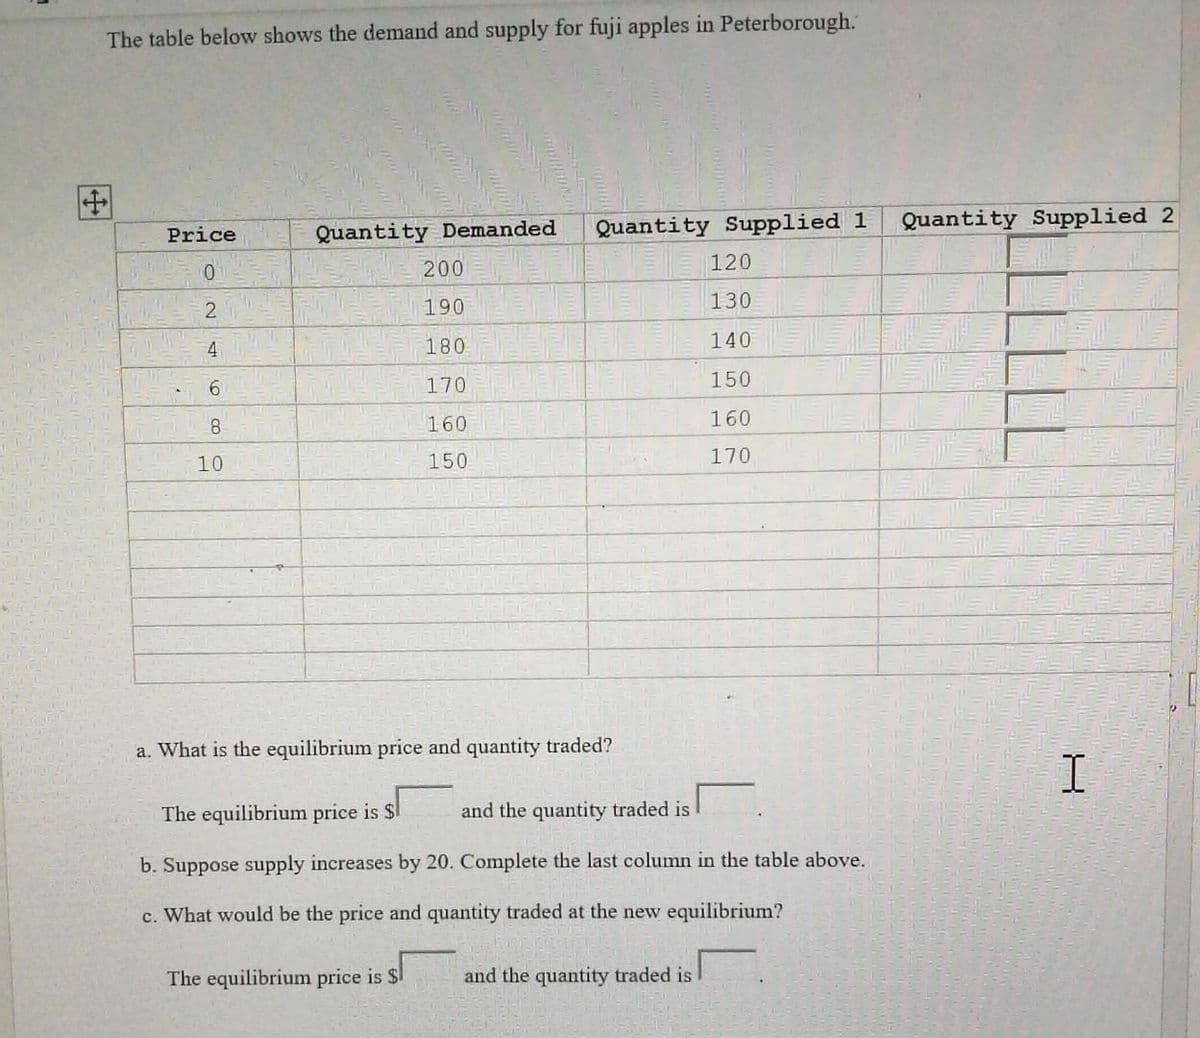
Transcribed Image Text:The table below shows the demand and supply for fuji apples in Peterborough.
田
ITT
Quantity Supplied 1
Quantity Supplied 2
Price
Quantity Demanded
0.
200
120
190
130
4
180
140
170
150
8.
160
160
10
150
170
a. What is the equilibrium price and quantity traded?
The equilibrium price is $l
and the quantity traded is
b. Suppose supply increases by 20. Complete the last column in the table above.
c. What would be the price and quantity traded at the new equilibrium?
The equilibrium price is $1
and the quantity traded is
Expert Solution
This question has been solved!
Explore an expertly crafted, step-by-step solution for a thorough understanding of key concepts.

Step by step
Solved in 4 steps

Knowledge Booster


Learn more about
Need a deep-dive on the concept behind this application? Look no further. Learn more about this topic, economics and related others by exploring similar questions and additional content below.Recommended textbooks for you
Principles of Economics (MindTap Course List)
Economics
ISBN:
9781305585126
Author:
N. Gregory Mankiw
Publisher:
Cengage Learning

Principles of Microeconomics (MindTap Course List)
Economics
ISBN:
9781305971493
Author:
N. Gregory Mankiw
Publisher:
Cengage Learning

Essentials of Economics (MindTap Course List)
Economics
ISBN:
9781337091992
Author:
N. Gregory Mankiw
Publisher:
Cengage Learning
Principles of Economics (MindTap Course List)
Economics
ISBN:
9781305585126
Author:
N. Gregory Mankiw
Publisher:
Cengage Learning
Principles of Microeconomics (MindTap Course List)
Economics
ISBN:
9781305971493
Author:
N. Gregory Mankiw
Publisher:
Cengage Learning
Essentials of Economics (MindTap Course List)
Economics
ISBN:
9781337091992
Author:
N. Gregory Mankiw
Publisher:
Cengage Learning

Principles of Economics, 7th Edition (MindTap Cou…
Economics
ISBN:
9781285165875
Author:
N. Gregory Mankiw
Publisher:
Cengage Learning

