Aaron owns a two-stock portfolio that invests in Happy Dog Soap Company (HDS) and Black Sheep Broadcasting (BSB). Three-quarters of Aaron's portfolio value consists of HDS's shares, and the balance consists of BSB's shares. Each stock's expected return for the next year will depend on forecasted market conditions. The expected returns from the stocks in different market conditions are detailed in the following table: Market Condition Probability of Occurrence 0.20 0.35 0.45 Strong Normal Weak Happy Dog Soap 17.5% 10.5% -14% • The expected rate of return on Happy Dog Soap's stock over the next year is • The expected rate of return on Black Sheep Broadcasting's stock over the nex • The expected rate of return on Aaron's portfolio over the next year is Black Sheep Broadcasting Calculate expected returns for the individual stocks in Aaron's portfolio as well as the expected rate of return of the entire portfolio over the three possible market conditions next year. The expected returns for Aaron's portfolio were calculated based on three possib time, and for each condition there will be a specific outcome. These probabilities 1.19% 1.06% 24.5% 14% -17.5% 0.75% ons in the market. Such conditions will vary from time to omes can be represented in the form of a continuous
Aaron owns a two-stock portfolio that invests in Happy Dog Soap Company (HDS) and Black Sheep Broadcasting (BSB). Three-quarters of Aaron's portfolio value consists of HDS's shares, and the balance consists of BSB's shares. Each stock's expected return for the next year will depend on forecasted market conditions. The expected returns from the stocks in different market conditions are detailed in the following table: Market Condition Probability of Occurrence 0.20 0.35 0.45 Strong Normal Weak Happy Dog Soap 17.5% 10.5% -14% • The expected rate of return on Happy Dog Soap's stock over the next year is • The expected rate of return on Black Sheep Broadcasting's stock over the nex • The expected rate of return on Aaron's portfolio over the next year is Black Sheep Broadcasting Calculate expected returns for the individual stocks in Aaron's portfolio as well as the expected rate of return of the entire portfolio over the three possible market conditions next year. The expected returns for Aaron's portfolio were calculated based on three possib time, and for each condition there will be a specific outcome. These probabilities 1.19% 1.06% 24.5% 14% -17.5% 0.75% ons in the market. Such conditions will vary from time to omes can be represented in the form of a continuous

Chapter8: Analysis Of Risk And Return
Section: Chapter Questions
Problem 13QTD

Related questions
Question
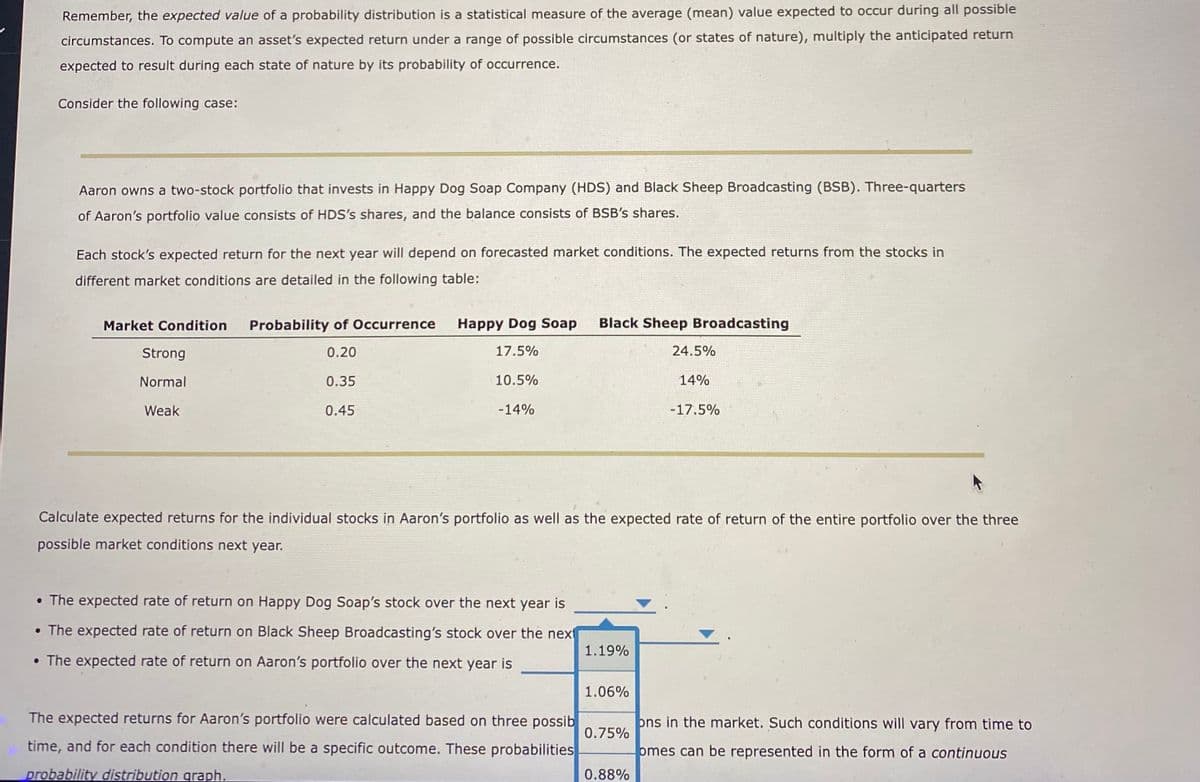
Transcribed Image Text:Remember, the expected value of a probability distribution is a statistical measure of the average (mean) value expected to occur during all possible
circumstances. To compute an asset's expected return under a range of possible circumstances (or states of nature), multiply the anticipated return
expected to result during each state of nature by its probability of occurrence.
Consider the following case:
Aaron owns a two-stock portfolio that invests in Happy Dog Soap Company (HDS) and Black Sheep Broadcasting (BSB). Three-quarters
of Aaron's portfolio value consists of HDS's shares, and the balance consists of BSB's shares.
Each stock's expected return for the next year will depend on forecasted market conditions. The expected returns from the stocks in
different market conditions are detailed in the following table:
Market Condition Probability of Occurrence
0.20
0.35
0.45
Strong
Normal
Weak
Happy Dog Soap
17.5%
10.5%
-14%
• The expected rate of return on Happy Dog Soap's stock over the next year is
●
• The expected rate of return on Black Sheep Broadcasting's stock over the next
• The expected rate of return on Aaron's portfolio over the next year is
Black Sheep Broadcasting
The expected returns for Aaron's portfolio were calculated based on three possib
time, and for each condition there will be a specific outcome. These probabilities
probability distribution graph.
Calculate expected returns for the individual stocks in Aaron's portfolio as well as the expected rate of return of the entire portfolio over the three
possible market conditions next year.
1.19%
1.06%
0.75%
24.5%
0.88%
14%
-17.5%
ons in the market. Such conditions will vary from time to
omes can be represented in the form of a continuous
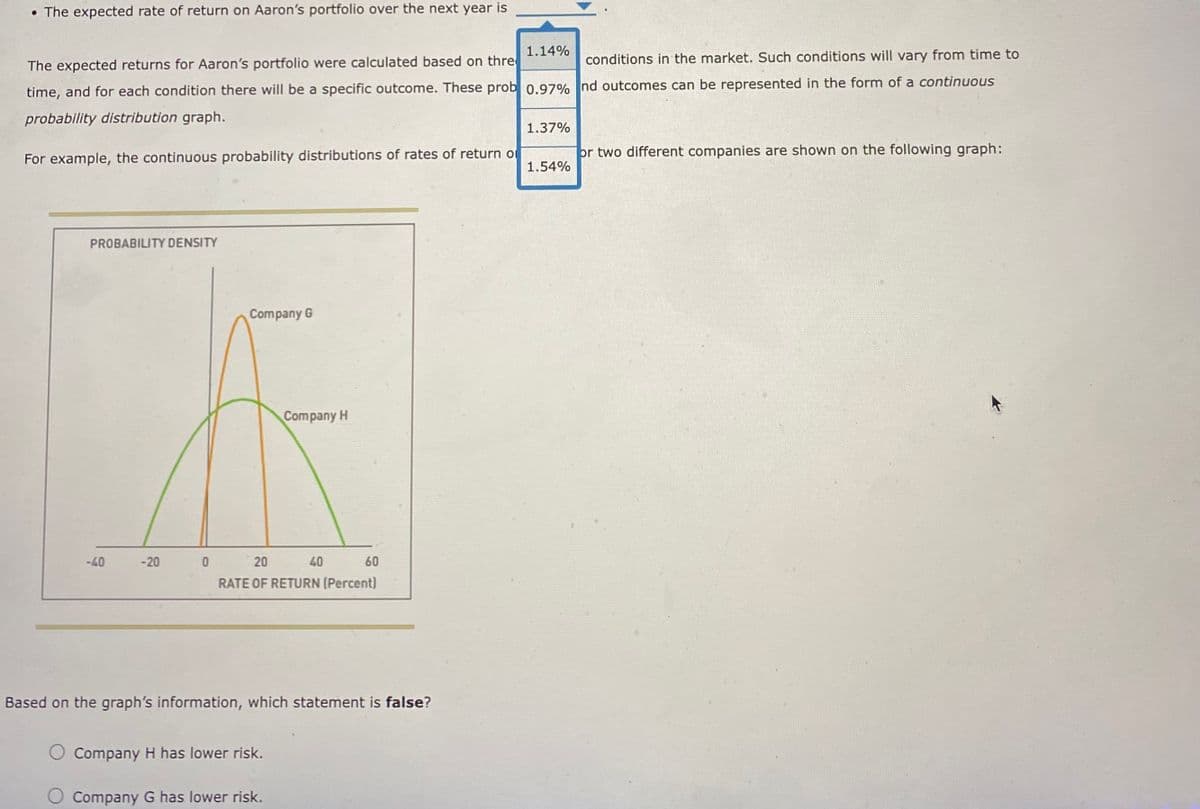
Transcribed Image Text:. The expected rate of return on Aaron's portfolio over the next year is
conditions in the market. Such conditions will vary from time to
The expected returns for Aaron's portfolio were calculated based on thre
time, and for each condition there will be a specific outcome. These prob 0.97% nd outcomes can be represented in the form of a continuous
probability distribution graph.
For example, the continuous probability distributions of rates of return o
PROBABILITY DENSITY
-40
Company G
Company H
5
20
RATE OF RETURN (Percent)
-20
0
40
O Company H has lower risk.
Company G has lower risk.
60
Based on the graph's information, which statement is false?
1.14%
1.37%
1.54%
or two different companies are shown on the following graph:
Expert Solution
This question has been solved!
Explore an expertly crafted, step-by-step solution for a thorough understanding of key concepts.

This is a popular solution!

Trending now
This is a popular solution!

Step by step
Solved in 3 steps with 2 images

Knowledge Booster


Learn more about
Need a deep-dive on the concept behind this application? Look no further. Learn more about this topic, finance and related others by exploring similar questions and additional content below.Recommended textbooks for you
EBK CONTEMPORARY FINANCIAL MANAGEMENT
Finance
ISBN:
9781337514835
Author:
MOYER
Publisher:
CENGAGE LEARNING - CONSIGNMENT


Intermediate Financial Management (MindTap Course…
Finance
ISBN:
9781337395083
Author:
Eugene F. Brigham, Phillip R. Daves
Publisher:
Cengage Learning
EBK CONTEMPORARY FINANCIAL MANAGEMENT
Finance
ISBN:
9781337514835
Author:
MOYER
Publisher:
CENGAGE LEARNING - CONSIGNMENT
Intermediate Financial Management (MindTap Course…
Finance
ISBN:
9781337395083
Author:
Eugene F. Brigham, Phillip R. Daves
Publisher:
Cengage Learning
