ABC Cookie Company takes samples of finished boxes of cookies weighing them to make sure the weight filled stays within the targeted amount. Some variation of course, is to be expected. But too much presents a production issue. Your job is to find out if this process is stable enough to continue. Samples are taken for 20 days. The number of boxes checked each day is 100. The 20 samples measured reveal the following proportions found to have defective weights: Sample Number Of Defectives Proportion Defective 1 2 3 4 5 6 7 8 9 10 11 12 13 14 15 16 17 18


ABC Cookie Company takes samples of finished boxes of cookies weighing them to make sure the weight filled stays within the targeted amount. Some variation of course, is to be expected. But too much presents a production issue. Your job is to find out if this process is stable enough to continue.
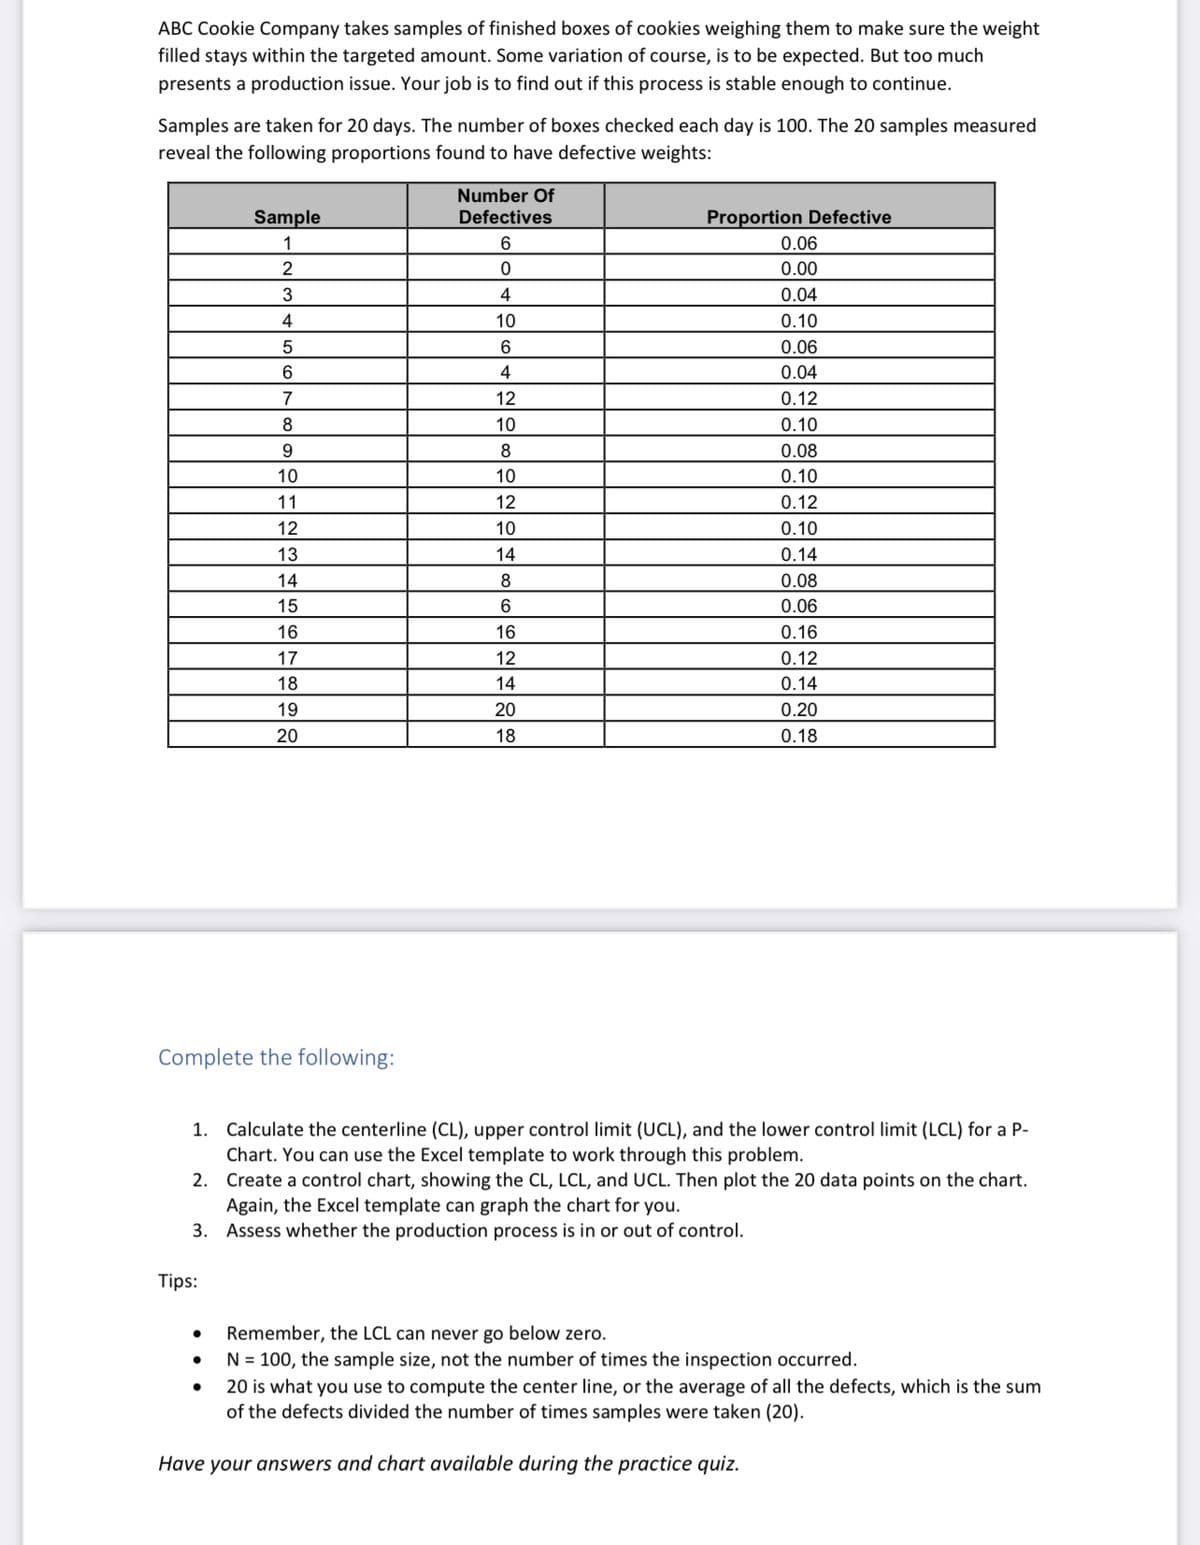
Samples are taken for 20 days. The number of boxes checked each day is 100. The 20 samples measured reveal the following proportions found to have defective weights:
|
Sample |
Number Of Defectives |
Proportion Defective |
6 0.06 0 0.00 4 0.04
10 0.10 6 0.06 4 0.04
12 0.12 10 0.10 8 0.08 10 0.10 12 0.12 10 0.10 14 0.14 8 0.08 6 0.06 16 0.16 12 0.12 14 0.14 20 0.20 18 0.18
Complete the following:
-
Calculate the centerline (CL), upper control limit (UCL), and the lower control limit (LCL) for a P- Chart. You can use the Excel template to work through this problem.
-
Create a control chart, showing the CL, LCL, and UCL. Then plot the 20 data points on the chart. Again, the Excel template can graph the chart for you.
-
Assess whether the production process is in or out of control.
Tips:
-
Remember, the LCL can never go below zero.
-
N = 100, the sample size, not the number of times the inspection occurred.
-
20 is what you use to compute the center line, or the average of all the defects, which is the sum
of the defects divided the number of times samples were taken (20).
Have your answers and chart available during the practice quiz.

Step by step
Solved in 3 steps with 1 images
