According to a recent survey of 1700 people, 61% feel that the president is doing an acceptable job. We are interested in the population proportion of people who feel the president is doing an acceptable job. NOTE: If you are using a Student's t-distribution, you may assume that the underlying population is normally distributed. (In general, you must first prove that assumption, though.)
According to a recent survey of 1700 people, 61% feel that the president is doing an acceptable job. We are interested in the population proportion of people who feel the president is doing an acceptable job. NOTE: If you are using a Student's t-distribution, you may assume that the underlying population is normally distributed. (In general, you must first prove that assumption, though.)

Holt Mcdougal Larson Pre-algebra: Student Edition 2012
1st Edition
ISBN:9780547587776
Author:HOLT MCDOUGAL
Publisher:HOLT MCDOUGAL
Chapter11: Data Analysis And Probability
Section: Chapter Questions
Problem 8CR

Related questions

Question
100%
According to a recent survey of 1700 people, 61% feel that the president is doing an acceptable job. We are interested in the population proportion of people who feel the president is doing an acceptable job.
NOTE: If you are using a Student's t-distribution, you may assume that the underlying population is
Transcribed Image Text:O Part (c)
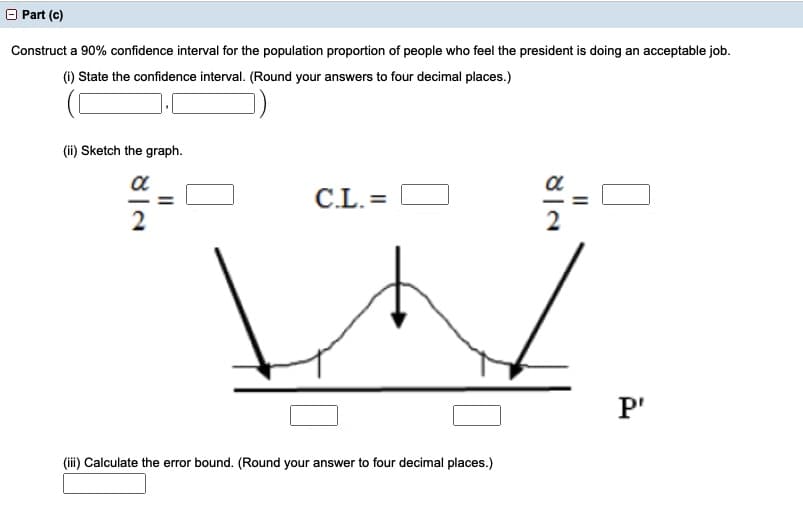
Construct a 90% confidence interval for the population proportion of people who feel the president is doing an acceptable job.
(i) State the confidence interval. (Round your answers to four decimal places.)
(ii) Sketch the graph.
a
C.L. =
2
P'
(iii) Calculate the error bound. (Round your answer to four decimal places.)
Transcribed Image Text:O Part (a)
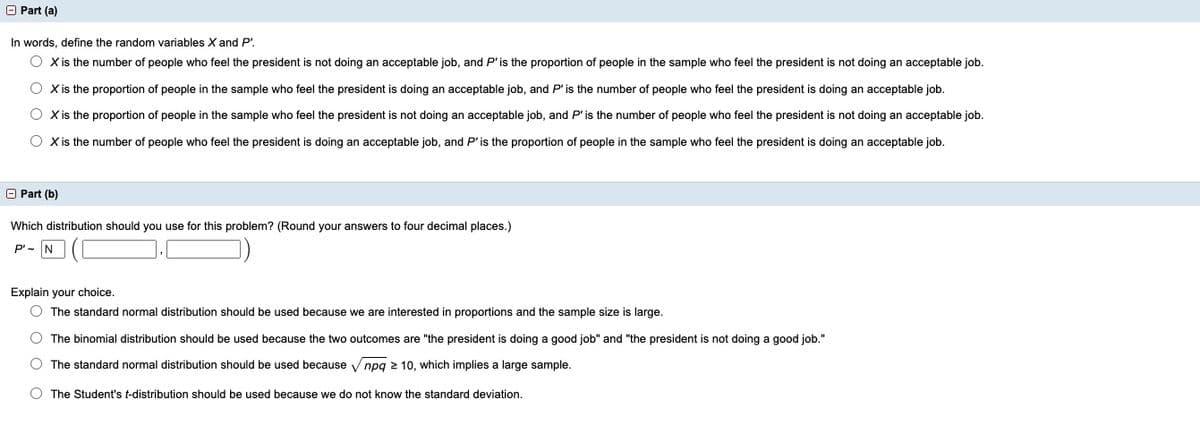
In words, define the random variables X and P'.
O Xis the number of people who feel the president is not doing an acceptable job, and P' is the proportion of people in the sample who feel the president is not doing an acceptable job.
O Xis the proportion of people in the sample who feel the president is doing an acceptable job, and P' is the number of people who feel the president is doing an acceptable job.
O Xis the proportion of people in the sample who feel the president is not doing an acceptable job, and P'is the number of people who feel the president
not doing an acceptable job.
O Xis the number of people who feel the president is doing an acceptable job, and P'is the proportion of people in the sample who feel the president is doing an acceptable job.
O Part (b)
Which distribution should you use for this problem? (Round your answers to four decimal places.)
P'- N
Explain your choice.
O The standard normal distribution should be used because we are interested in proportions and the sample size is large.
The binomial distribution should be used because the two outcomes are "the president is doing a good job" and "the president is not doing a good job."
O The standard normal distribution should be used because V npq 2 10, which implies a large sample.
The Student's t-distribution should be used because we do not know the standard deviation.
Expert Solution
This question has been solved!
Explore an expertly crafted, step-by-step solution for a thorough understanding of key concepts.

This is a popular solution!

Trending now
This is a popular solution!

Step by step
Solved in 2 steps

Knowledge Booster


Learn more about
Need a deep-dive on the concept behind this application? Look no further. Learn more about this topic, statistics and related others by exploring similar questions and additional content below.Recommended textbooks for you
Holt Mcdougal Larson Pre-algebra: Student Edition…
Algebra
ISBN:
9780547587776
Author:
HOLT MCDOUGAL
Publisher:
HOLT MCDOUGAL

Holt Mcdougal Larson Pre-algebra: Student Edition…
Algebra
ISBN:
9780547587776
Author:
HOLT MCDOUGAL
Publisher:
HOLT MCDOUGAL