According to a study done by Nick Wilson of Otago University Wellington, the probability a randomly selected individual will not cover his or her mouth when sneezing is 0.267. Suppose you sit on a bench in a mall and observe people's habits as they sneeze. Complete parts (a) through (c). (a) What is the probability that among 16 randomly observed individuals, exactly 7 do not cover their mouth when sneezing? Using the binomial distribution, the probability is: (Round to four decimal places as needed.) (b) What is the probability that among 16 randomly observed individuals, fewer than 3 do not cover their mouth when sneezing? Using the binomial distribution, the probability is. (Round to four decimal places as needed.) (c) Would you be surprised if, after observing 16 individuals, fewer than half covered their mouth when sneezing? Why? V be surprising, because using the binomial distribution, the probability is, which is V 0.05. (Round to four decimal places as needed.)
According to a study done by Nick Wilson of Otago University Wellington, the probability a randomly selected individual will not cover his or her mouth when sneezing is 0.267. Suppose you sit on a bench in a mall and observe people's habits as they sneeze. Complete parts (a) through (c). (a) What is the probability that among 16 randomly observed individuals, exactly 7 do not cover their mouth when sneezing? Using the binomial distribution, the probability is: (Round to four decimal places as needed.) (b) What is the probability that among 16 randomly observed individuals, fewer than 3 do not cover their mouth when sneezing? Using the binomial distribution, the probability is. (Round to four decimal places as needed.) (c) Would you be surprised if, after observing 16 individuals, fewer than half covered their mouth when sneezing? Why? V be surprising, because using the binomial distribution, the probability is, which is V 0.05. (Round to four decimal places as needed.)

Chapter8: Sequences, Series,and Probability
Section8.7: Probability
Problem 11ECP: A manufacturer has determined that a machine averages one faulty unit for every 500 it produces....

Related questions

Concept explainers
Contingency Table
A contingency table can be defined as the visual representation of the relationship between two or more categorical variables that can be evaluated and registered. It is a categorical version of the scatterplot, which is used to investigate the linear relationship between two variables. A contingency table is indeed a type of frequency distribution table that displays two variables at the same time.
Binomial Distribution
Binomial is an algebraic expression of the sum or the difference of two terms. Before knowing about binomial distribution, we must know about the binomial theorem.
Topic Video
Question
#24
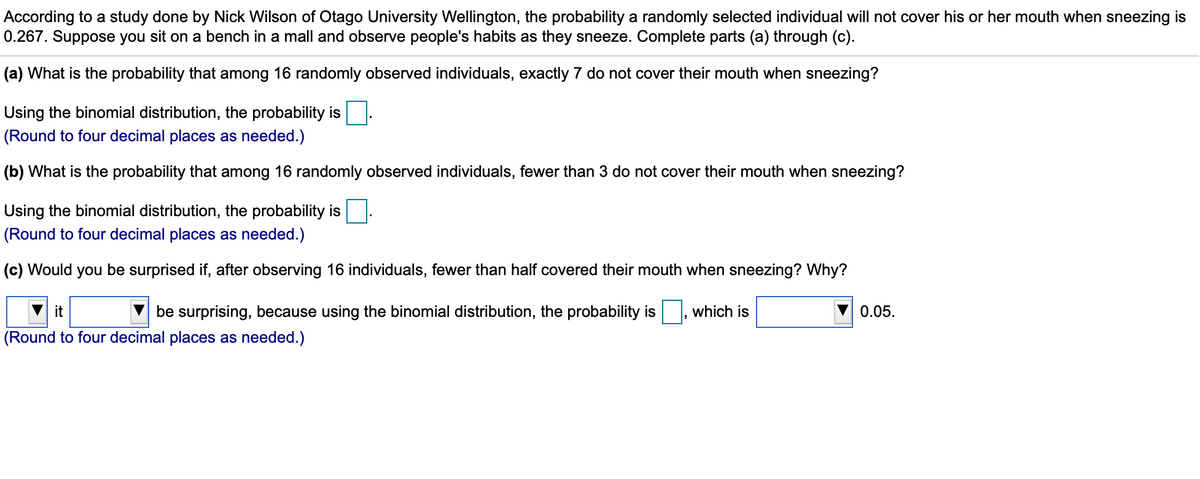
Transcribed Image Text:According to a study done by Nick Wilson of Otago University Wellington, the probability a randomly selected individual will not cover his or her mouth when sneezing is
0.267. Suppose you sit on a bench in a mall and observe people's habits as they sneeze. Complete parts (a) through (c).
(a) What is the probability that among 16 randomly observed individuals, exactly 7 do not cover their mouth when sneezing?
Using the binomial distribution, the probability is
(Round to four decimal places as needed.)
(b) What is the probability that among 16 randomly observed individuals, fewer than 3 do not cover their mouth when sneezing?
Using the binomial distribution, the probability is
(Round to four decimal places as needed.)
(c) Would you be surprised if, after observing 16 individuals, fewer than half covered their mouth when sneezing? Why?
it
be surprising, because using the binomial distribution, the probability is
which is
0.05.
(Round to four decimal places as needed.)
Expert Solution
This question has been solved!
Explore an expertly crafted, step-by-step solution for a thorough understanding of key concepts.

This is a popular solution!

Trending now
This is a popular solution!

Step by step
Solved in 4 steps with 4 images

Knowledge Booster


Learn more about
Need a deep-dive on the concept behind this application? Look no further. Learn more about this topic, statistics and related others by exploring similar questions and additional content below.Recommended textbooks for you