According to a study, the proportion of people who are satisfied with the way things are yo Complete parts (a) through (e) below. Click here to view the standard normal distribution table (page 1). Click here to view the standard normal distribution table (page 2). (a) Suppose the random sample of 100 people is asked, "Are you satisfied with the way things are going in your life?" Is the response to this question qualitative or quantitative Explain. O A. The response is quantitative because the number of people satisfied can be counted. OB. The response is qualitative because the number of people satisfied can be counted. OC. The response is qualitative because the responses can be classified based on the characteristic of being satisfied or not. OD. The response is quantitative because the responses can be classified based on the characteristic of being satisfied or not. (b) Explain why the sample proportion, p, is a random variable. What is the source of the variability? OA. The sample proportion p is a random variable because the value of p represents a random person included in the sample. The variability is due to the fact that people not be responding to the question truthfully. OB. The sample proportion p is a random variable because the value of p represents a random person included in the sample. The variability is due to the fact that differen people feel differently regarding their satisfaction. Ne
According to a study, the proportion of people who are satisfied with the way things are yo Complete parts (a) through (e) below. Click here to view the standard normal distribution table (page 1). Click here to view the standard normal distribution table (page 2). (a) Suppose the random sample of 100 people is asked, "Are you satisfied with the way things are going in your life?" Is the response to this question qualitative or quantitative Explain. O A. The response is quantitative because the number of people satisfied can be counted. OB. The response is qualitative because the number of people satisfied can be counted. OC. The response is qualitative because the responses can be classified based on the characteristic of being satisfied or not. OD. The response is quantitative because the responses can be classified based on the characteristic of being satisfied or not. (b) Explain why the sample proportion, p, is a random variable. What is the source of the variability? OA. The sample proportion p is a random variable because the value of p represents a random person included in the sample. The variability is due to the fact that people not be responding to the question truthfully. OB. The sample proportion p is a random variable because the value of p represents a random person included in the sample. The variability is due to the fact that differen people feel differently regarding their satisfaction. Ne

Glencoe Algebra 1, Student Edition, 9780079039897, 0079039898, 2018
18th Edition
ISBN:9780079039897
Author:Carter
Publisher:Carter
Chapter10: Statistics
Section10.4: Distributions Of Data
Problem 19PFA

Related questions
Question
According to a study, the proportion of people who are satisfied with the way things are going in their lives is 0.80. Suppose that a random sample of 100 people is obtained
Transcribed Image Text:=
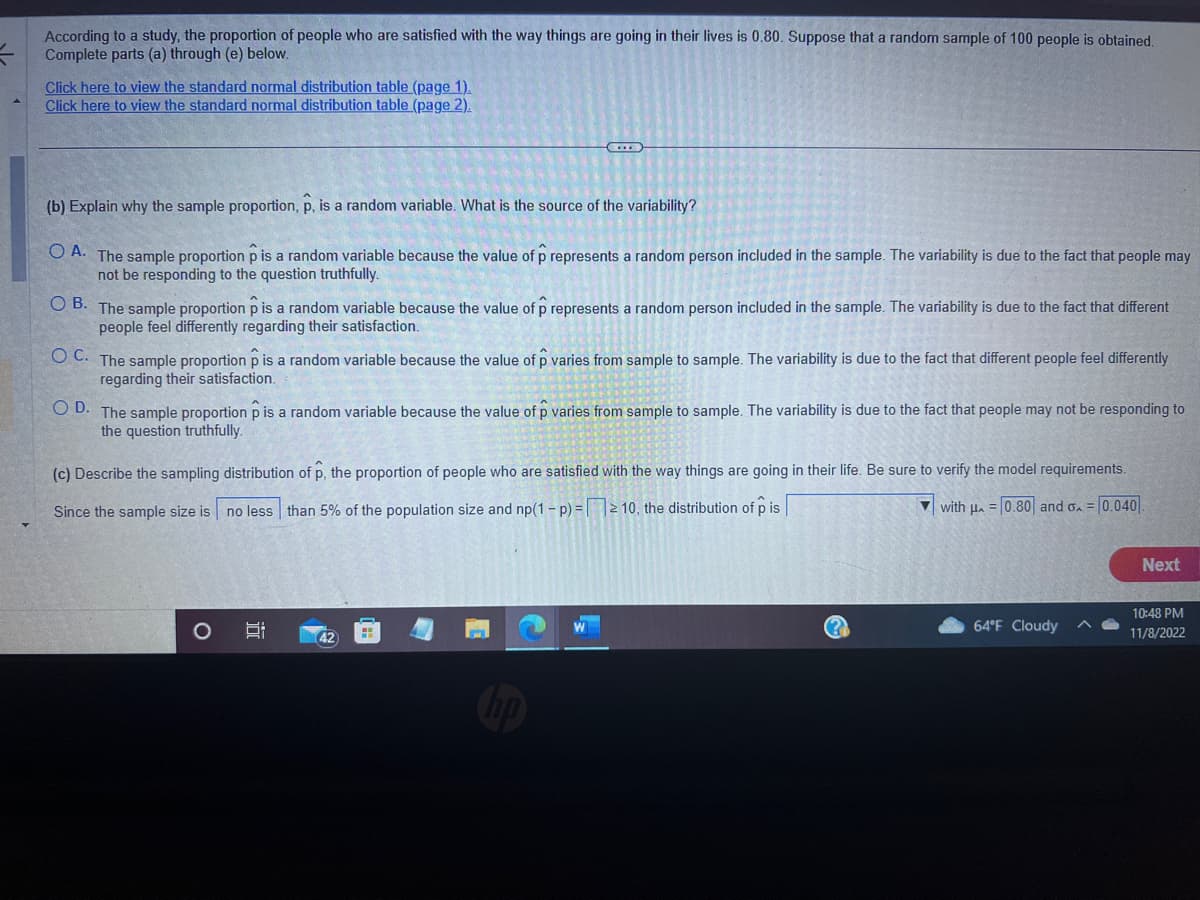
According to a study, the proportion of people who are satisfied with the way things are going in their lives is 0.80. Suppose that a random sample of 100 people is obtained.
Complete parts (a) through (e) below.
Click here to view the standard normal distribution table (page 1).
Click here to view the standard normal distribution table (page 2).
(b) Explain why the sample proportion, p, is a random variable. What is the source of the variability?
OA. The sample proportion p is a random variable because the value of p represents a random person included in the sample. The variability is due to the fact that people may
not be responding to the question truthfully.
OB. The sample proportion p is a random variable because the value of p represents a random person included in the sample. The variability is due to the fact that different
people feel differently regarding their satisfaction.
OC. The sample proportion p is a random variable because the value of p varies from sample to sample. The variability is due to the fact that different people feel differently
regarding their satisfaction.
O D. The sample proportion p is a random variable because the value of p varies from sample to sample. The variability is due to the fact that people may not be responding to
the question truthfully.
(c) Describe the sampling distribution of p, the proportion of people who are satisfied with the way things are going in their life. Be sure to verify the model requirements.
Since the sample size is no less than 5% of the population size and np(1-p) =
10, the distribution of p is
with μ = 0.80 and o=0.040
O
100
42 H
(?)
64°F Cloudy
Next
10:48 PM
11/8/2022
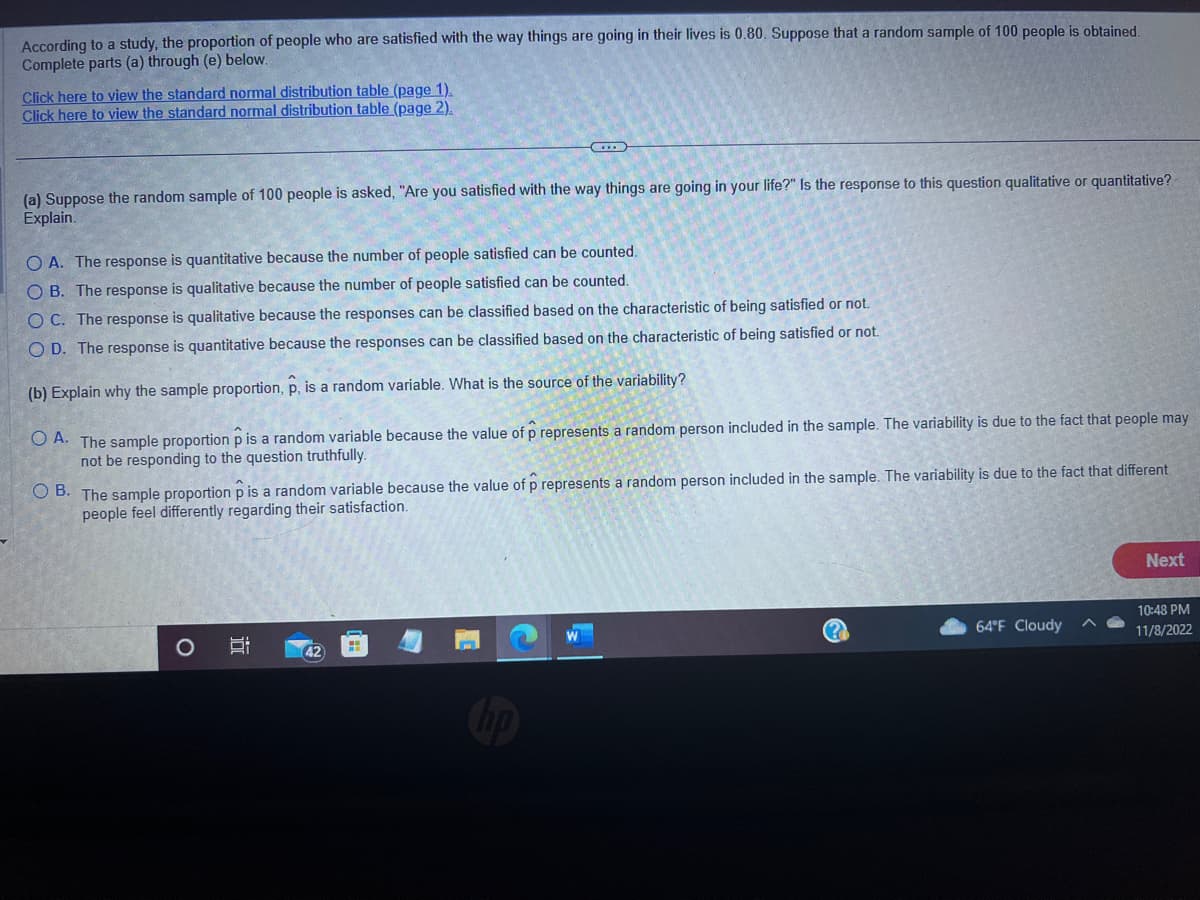
Transcribed Image Text:According to a study, the proportion of people who are satisfied with the way things are going in their lives is 0.80. Suppose that a random sample of 100 people is obtained.
Complete parts (a) through (e) below.
Click here to view the standard normal distribution table (page 1).
Click here to view the standard normal distribution table (page 2).
(a) Suppose the random sample of 100 people is asked, "Are you satisfied with the way things are going in your life?" Is the response to this question qualitative or quantitative?
Explain.
O A. The response is quantitative because the number of people satisfied can be counted.
OB. The response is qualitative because the number of people satisfied can be counted.
OC. The response is qualitative because the responses can be classified based on the characteristic of being satisfied or not.
O D. The response is quantitative because the responses can be classified based on the characteristic of being satisfied or not.
(b) Explain why the sample proportion, p, is a random variable. What is the source of the variability?
OA. The sample proportion p is a random variable because the value of p represents a random person included in the sample. The variability is due to the fact that people may
not be responding to the question truthfully.
OB. The sample proportion p is a random variable because the value of p represents a random person included in the sample. The variability is due to the fact that different
people feel differently regarding their satisfaction.
O
i
42
64°F Cloudy
Next
10:48 PM
11/8/2022
Expert Solution
This question has been solved!
Explore an expertly crafted, step-by-step solution for a thorough understanding of key concepts.

Step by step
Solved in 2 steps

Recommended textbooks for you
Glencoe Algebra 1, Student Edition, 9780079039897…
Algebra
ISBN:
9780079039897
Author:
Carter
Publisher:
McGraw Hill
Glencoe Algebra 1, Student Edition, 9780079039897…
Algebra
ISBN:
9780079039897
Author:
Carter
Publisher:
McGraw Hill