According to an article in Newsweek, the natural ratio of girls to boys is 100:105. In China, the birth ratio is 100:114 (46.7% girls). Suppose you don't believe the reported figures of the percent of girls born in China. You conduct a study. In this study, count the number girls and boys born in 150 randomly chosen recent births. There are 61 girls and 89 boys born of the 150. Based on your study, do you believe that the percent of girls born in China is 46.7? Conduct a hypothesis test at the 5% leve Note: If you are using a Student's t-distribution for the problem, you may assume that the underlying population is normally distributed. (In general, you must first prove that assumption, though.) O Part (a) O Part (b) O Part (c) O Part (d) State the distribution to use for the test. (Round your standard deviation to four decimal places.) O Part (e) What is the test statistic? (Round your answer to two decimal places.) --Select-- v= O Part (f) What is the p-value? (Round your answer to four decimal places.) Explain what the p-value means for this problem. O F H, is true, then there is a chance equal to the p-value that the sample ratio is not 61 out of 150 or less OR 79 out of 150 or more. O H Họ is false, then there is a chance equal to the p-value that the sample ratio is 61 out of 150 or less OR 79 out of 150 or more. O f Ho is false, then there is a chance equal to the p-value that the sample ratio is not 61 out of 150 or less OR 79 out of 150 or more. O H Hg is true, then there is a chance equal to the p-value that the sample ratio is 61 out of 150 or less OR 79 out of 150 or more.
According to an article in Newsweek, the natural ratio of girls to boys is 100:105. In China, the birth ratio is 100:114 (46.7% girls). Suppose you don't believe the reported figures of the percent of girls born in China. You conduct a study. In this study, count the number girls and boys born in 150 randomly chosen recent births. There are 61 girls and 89 boys born of the 150. Based on your study, do you believe that the percent of girls born in China is 46.7? Conduct a hypothesis test at the 5% leve Note: If you are using a Student's t-distribution for the problem, you may assume that the underlying population is normally distributed. (In general, you must first prove that assumption, though.) O Part (a) O Part (b) O Part (c) O Part (d) State the distribution to use for the test. (Round your standard deviation to four decimal places.) O Part (e) What is the test statistic? (Round your answer to two decimal places.) --Select-- v= O Part (f) What is the p-value? (Round your answer to four decimal places.) Explain what the p-value means for this problem. O F H, is true, then there is a chance equal to the p-value that the sample ratio is not 61 out of 150 or less OR 79 out of 150 or more. O H Họ is false, then there is a chance equal to the p-value that the sample ratio is 61 out of 150 or less OR 79 out of 150 or more. O f Ho is false, then there is a chance equal to the p-value that the sample ratio is not 61 out of 150 or less OR 79 out of 150 or more. O H Hg is true, then there is a chance equal to the p-value that the sample ratio is 61 out of 150 or less OR 79 out of 150 or more.

Glencoe Algebra 1, Student Edition, 9780079039897, 0079039898, 2018
18th Edition
ISBN:9780079039897
Author:Carter
Publisher:Carter
Chapter10: Statistics
Section10.6: Summarizing Categorical Data
Problem 26PPS

Related questions

Concept explainers
Contingency Table
A contingency table can be defined as the visual representation of the relationship between two or more categorical variables that can be evaluated and registered. It is a categorical version of the scatterplot, which is used to investigate the linear relationship between two variables. A contingency table is indeed a type of frequency distribution table that displays two variables at the same time.
Binomial Distribution
Binomial is an algebraic expression of the sum or the difference of two terms. Before knowing about binomial distribution, we must know about the binomial theorem.
Topic Video
Question
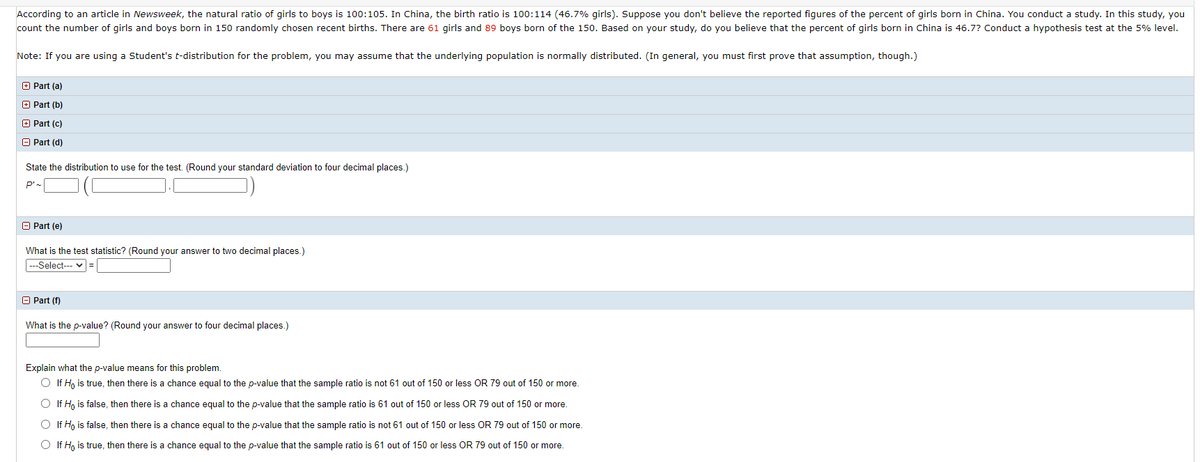
Transcribed Image Text:According to an article in Newsweek, the natural ratio of girls to boys is 100:105. In China, the birth ratio is 100:114 (46.7% girls). Suppose you don't believe the reported figures of the percent of girls born in China. You conduct a study. In this study, you
count the number of girls and boys born in 150 randomly chosen recent births. There are 61 girls and 89 boys born of the 150. Based on your study, do you believe that the percent of girls born in China is 46.7? Conduct a hypothesis test at the 5% level.
Note: If you are using a Student's t-distribution for the problem, you may assume that the underlying population is normally distributed. (In general, you must first prove that assumption, though.)
O Part (a)
+ Part (b)
O Part (c)
O Part (d)
State the distribution to use for the test. (Round your standard deviation to four decimal places.)
P'-
O Part (e)
What is the test statistic? (Round your answer to two decimal places.)
--Select-- v =
O Part (f)
What is the p-value? (Round your answer to four decimal places.)
Explain what the p-value means for this problem.
O If H, is true, then there is a chance equal to the p-value that the sample ratio is not 61 out of 150 or less OR 79 out of 150 or more.
O If H, is false, then there is a chance equal to the p-value that the sample ratio is 61 out of 150 or less OR 79 out of 150 or more.
O If H, is false, then there is a chance equal to the p-value that the sample ratio is not 61 out of 150 or less OR 79 out of 150 or more.
O If H, is true, then there is a chance equal to the p-value that the sample ratio is 61 out of 150 or less OR 79 out of 150 or more.
Expert Solution
This question has been solved!
Explore an expertly crafted, step-by-step solution for a thorough understanding of key concepts.

This is a popular solution!

Trending now
This is a popular solution!

Step by step
Solved in 2 steps

Knowledge Booster


Learn more about
Need a deep-dive on the concept behind this application? Look no further. Learn more about this topic, statistics and related others by exploring similar questions and additional content below.Recommended textbooks for you
Glencoe Algebra 1, Student Edition, 9780079039897…
Algebra
ISBN:
9780079039897
Author:
Carter
Publisher:
McGraw Hill

Holt Mcdougal Larson Pre-algebra: Student Edition…
Algebra
ISBN:
9780547587776
Author:
HOLT MCDOUGAL
Publisher:
HOLT MCDOUGAL

Algebra: Structure And Method, Book 1
Algebra
ISBN:
9780395977224
Author:
Richard G. Brown, Mary P. Dolciani, Robert H. Sorgenfrey, William L. Cole
Publisher:
McDougal Littell
Glencoe Algebra 1, Student Edition, 9780079039897…
Algebra
ISBN:
9780079039897
Author:
Carter
Publisher:
McGraw Hill
Holt Mcdougal Larson Pre-algebra: Student Edition…
Algebra
ISBN:
9780547587776
Author:
HOLT MCDOUGAL
Publisher:
HOLT MCDOUGAL
Algebra: Structure And Method, Book 1
Algebra
ISBN:
9780395977224
Author:
Richard G. Brown, Mary P. Dolciani, Robert H. Sorgenfrey, William L. Cole
Publisher:
McDougal Littell