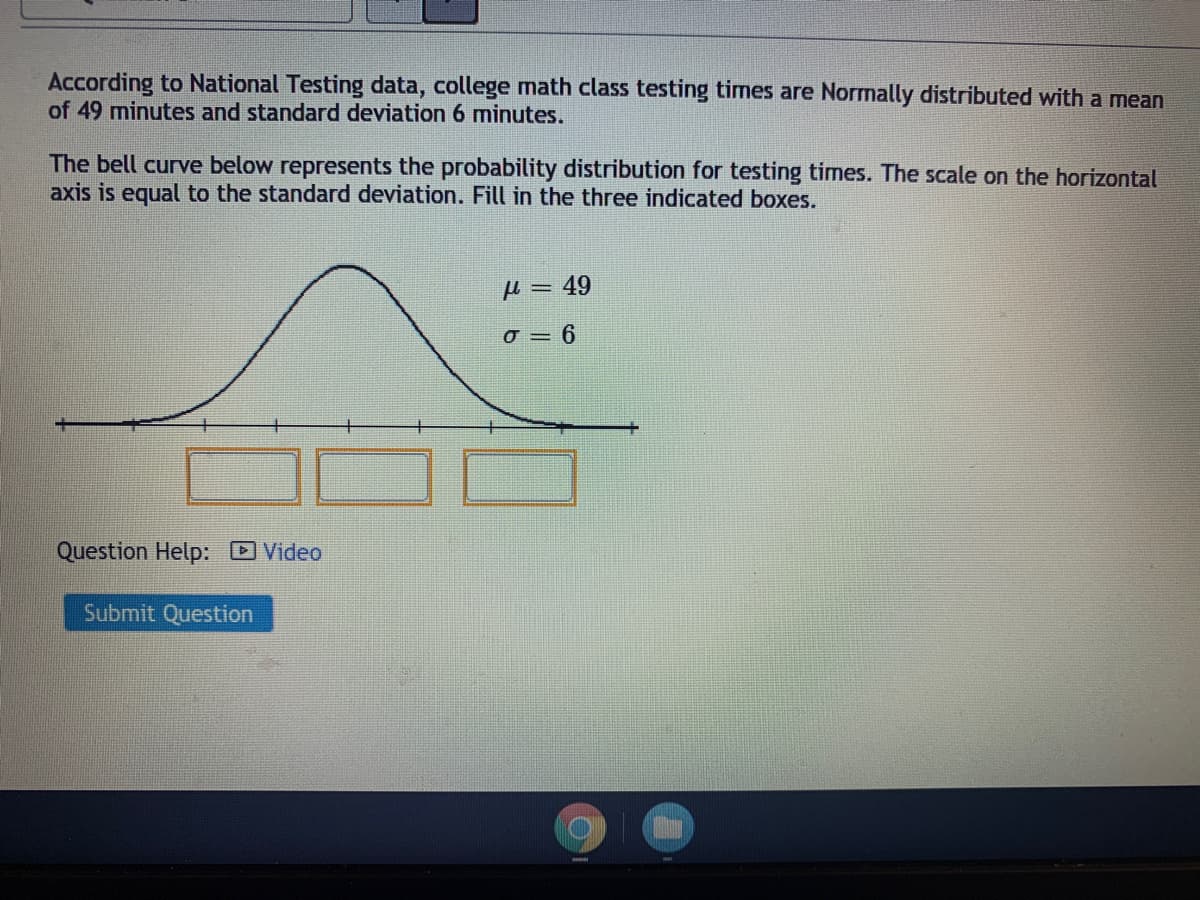
According to National Testing data, college math class testing times are Normally distributed with a mean of 49 minutes and standard deviation 6 minutes. The bell curve below represents the probability distribution for testing times. The scale on the horizontal axis is equal to the standard deviation. Fill in the three indicated boxes.
According to National Testing data, college math class testing times are Normally distributed with a mean of 49 minutes and standard deviation 6 minutes. The bell curve below represents the probability distribution for testing times. The scale on the horizontal axis is equal to the standard deviation. Fill in the three indicated boxes.

Glencoe Algebra 1, Student Edition, 9780079039897, 0079039898, 2018
18th Edition
ISBN:9780079039897
Author:Carter
Publisher:Carter
Chapter10: Statistics
Section10.4: Distributions Of Data
Problem 19PFA

Related questions
Question
Transcribed Image Text:According to National Testing data, college math class testing times are Normally distributed with a mean
of 49 minutes and standard deviation 6 minutes.
The bell curve below represents the probability distribution for testing times. The scale on the horizontal
axis is equal to the standard deviation. Fill in the three indicated boxes.
H = 49
o = 6
Question Help: DVideo
Submit Question
Expert Solution
This question has been solved!
Explore an expertly crafted, step-by-step solution for a thorough understanding of key concepts.

This is a popular solution!

Trending now
This is a popular solution!

Step by step
Solved in 2 steps with 1 images

Recommended textbooks for you
Glencoe Algebra 1, Student Edition, 9780079039897…
Algebra
ISBN:
9780079039897
Author:
Carter
Publisher:
McGraw Hill
Glencoe Algebra 1, Student Edition, 9780079039897…
Algebra
ISBN:
9780079039897
Author:
Carter
Publisher:
McGraw Hill