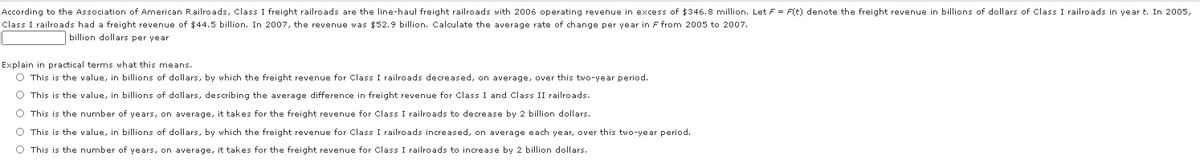
According to the Association of American Railroads, Class I freight railroads are the line-haul freight railroads vith 2006 operating revenue in excess of $346.8 million. Let F- F(e) denote the freight revenue in billions of dollars of Class I railroads in year t. In 2005, Class I railroads had a freight revenue of $44.5 billion. In 2007, the revenue vas $52.9 billion. Calculate the average rate of change per year in F from 2005 to 2007. billion dollars per year Explain in practical terms what this means. O This is the value, in billions of dollars, by vhich the freight revenue for Class I railroads decreased, on average, over this tvo-year period. O This is the value, in billions of dollars, describing the average difference in freight revenue for Class I and Class II railroads. O This is the number of years, on average, it takes for the freight revenue for Class I railroads to decrease by 2 billion dollars. O This is the value, in billions of dollars, by which the freight revenue for Class I railroads increased, on average each year, over this two-year period. O This is the number of vears, on for the freioht revenue for Class I railroads to ino 2 hillion dollar take


Equations and Inequations
Equations and inequalities describe the relationship between two mathematical expressions.
Linear Functions
A linear function can just be a constant, or it can be the constant multiplied with the variable like x or y. If the variables are of the form, x2, x1/2 or y2 it is not linear. The exponent over the variables should always be 1.
solve
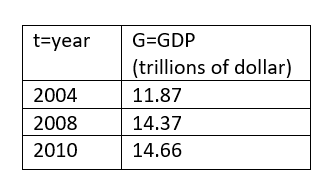
The following table shows the U.S gross domestic product in trillions of dollars as function of the year 't'
(a).
The meaning of G(2004) is the gross domestic product in the year 2004.
From the above table G(2004) = $ 11.87 trillion.
(b)
The functional notation to express the gross domestic in 2006 is G(2006)
The average increase from 2004 to 2006 is
So, the value of G(2006) = $13.12 trillion.

Trending now
This is a popular solution!

Step by step
Solved in 2 steps with 1 images


