According to the CIA's World Fact Book, in 2010, the population of the United States was approximately 310 million with a 0.97% annual growth rate. (Source: www.cia.gov) At this rate, the population P(t) (in millions) can be approximated by P(t) = 310(1.0097), where i is the time in years since 2010. a. Is the graph of P an increasing or decreasing exponential function? b. Evaluate P(0) and interpret its meaning in the context of this problem. c. Evaluate P(100) and interpret its meaning in the context of this problem. Round the population value to the nearest million. d. Evaluate P(20) and P(30). e. Evaluate P(200) and use this result to determine if it is reasonable to expect this model to continue indefinitely.
According to the CIA's World Fact Book, in 2010, the population of the United States was approximately 310 million with a 0.97% annual growth rate. (Source: www.cia.gov) At this rate, the population P(t) (in millions) can be approximated by P(t) = 310(1.0097), where i is the time in years since 2010. a. Is the graph of P an increasing or decreasing exponential function? b. Evaluate P(0) and interpret its meaning in the context of this problem. c. Evaluate P(100) and interpret its meaning in the context of this problem. Round the population value to the nearest million. d. Evaluate P(20) and P(30). e. Evaluate P(200) and use this result to determine if it is reasonable to expect this model to continue indefinitely.

Chapter6: Exponential And Logarithmic Functions
Section6.8: Fitting Exponential Models To Data
Problem 3TI: Table 6 shows the population, in thousands, of harbor seals in the Wadden Sea over the years 1997 to...

Related questions
Question
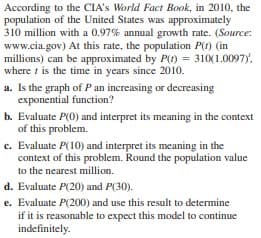
Transcribed Image Text:According to the CIA's World Fact Book, in 2010, the
population of the United States was approximately
310 million with a 0.97% annual growth rate. (Source:
www.cia.gov) At this rate, the population P(t) (in
millions) can be approximated by P(t) = 310(1.0097),
where i is the time in years since 2010.
a. Is the graph of P an increasing or decreasing
exponential function?
b. Evaluate P(0) and interpret its meaning in the context
of this problem.
c. Evaluate P(100) and interpret its meaning in the
context of this problem. Round the population value
to the nearest million.
d. Evaluate P(20) and P(30).
e. Evaluate P(200) and use this result to determine
if it is reasonable to expect this model to continue
indefinitely.
Expert Solution
This question has been solved!
Explore an expertly crafted, step-by-step solution for a thorough understanding of key concepts.

This is a popular solution!

Trending now
This is a popular solution!

Step by step
Solved in 2 steps with 1 images

Recommended textbooks for you

College Algebra (MindTap Course List)
Algebra
ISBN:
9781305652231
Author:
R. David Gustafson, Jeff Hughes
Publisher:
Cengage Learning

Algebra & Trigonometry with Analytic Geometry
Algebra
ISBN:
9781133382119
Author:
Swokowski
Publisher:
Cengage
College Algebra (MindTap Course List)
Algebra
ISBN:
9781305652231
Author:
R. David Gustafson, Jeff Hughes
Publisher:
Cengage Learning
Algebra & Trigonometry with Analytic Geometry
Algebra
ISBN:
9781133382119
Author:
Swokowski
Publisher:
Cengage

Trigonometry (MindTap Course List)
Trigonometry
ISBN:
9781337278461
Author:
Ron Larson
Publisher:
Cengage Learning


Algebra and Trigonometry (MindTap Course List)
Algebra
ISBN:
9781305071742
Author:
James Stewart, Lothar Redlin, Saleem Watson
Publisher:
Cengage Learning